Introduction
This article provides a detailed explanation on how to add supplementary information to the registered terrain data.
For instance, elevation and slopes can be visualized using heatmaps, and the terrain's elevation can be represented with contour lines. This method allows for the addition of insights not readily apparent solely from the terrain data.
Procedures and Explanation
1. Click the ”Measurements ” in the side panel.
2. Click "Terrain" in the viewer.
You can add supplementary information such as slope, elevation, and contours.
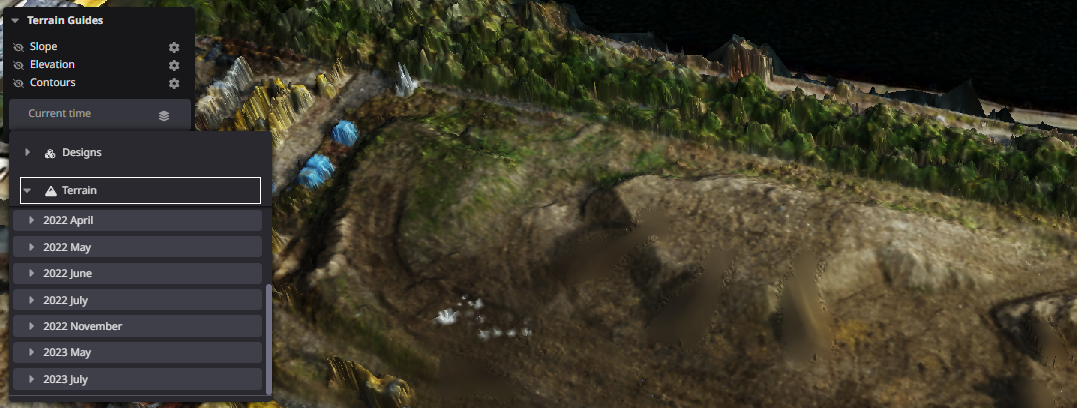
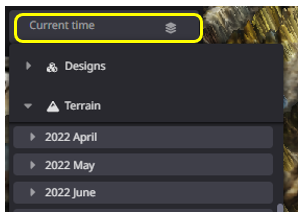
3. If not selected, the current time (most recently registered data) will be referred to.
Regardless of the viewer currently being displayed, you can also arbitrarily select the target data from "Design" and "Terrain".
"Data layers"
4. Customize each setting
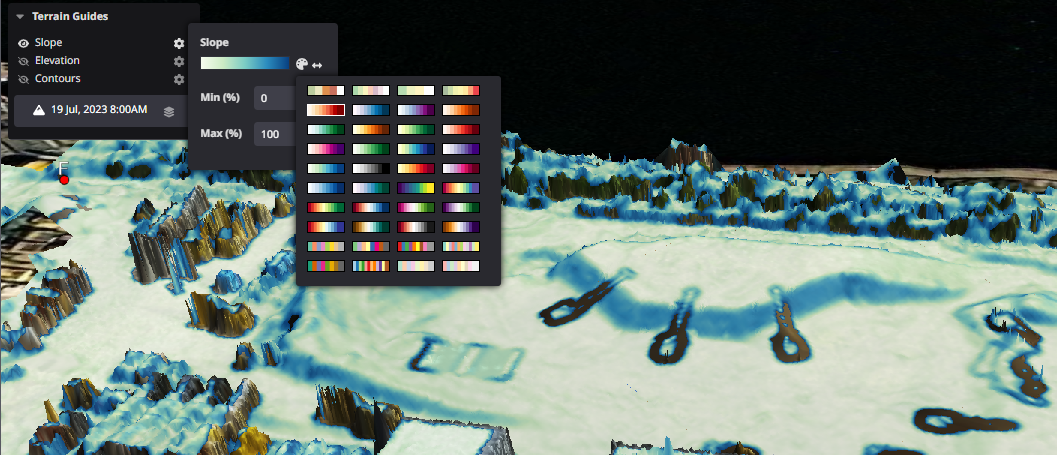
Change slope settings
Selecting the setting button gradates the slope of the terrain according to the set slope value threshold.
Determines the elevation of the point cloud data and adds it to the data.
"Project Settings"

Palette gradient replacement

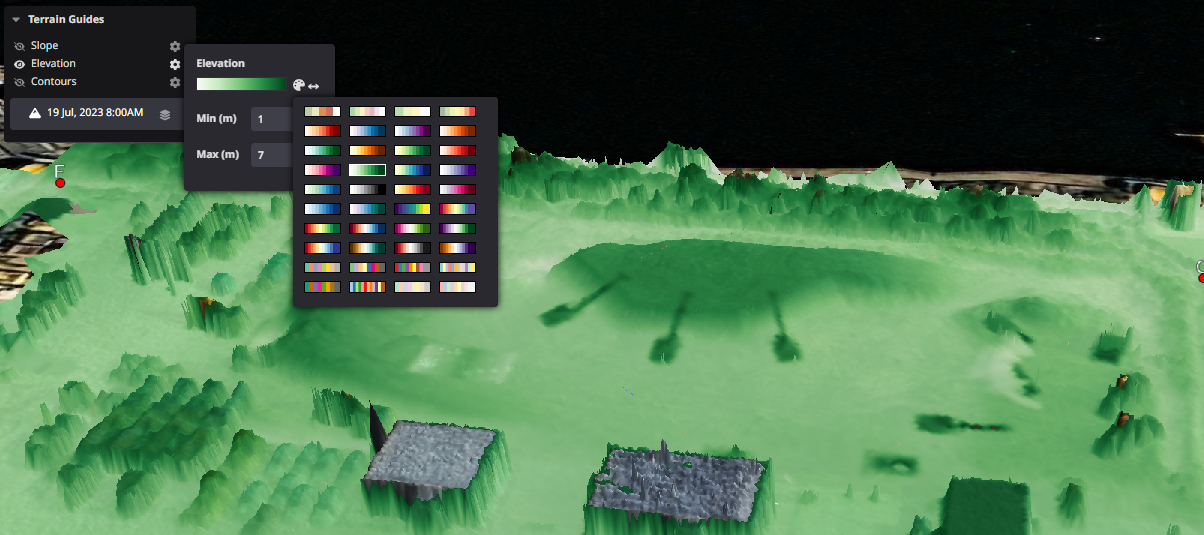
Change elevation settings
Selecting the setting button gradates the elevation of the terrain according to the set elevation threshold.
Determines and adds elevation to point cloud data
"Project Settings"

Palette gradient replacement

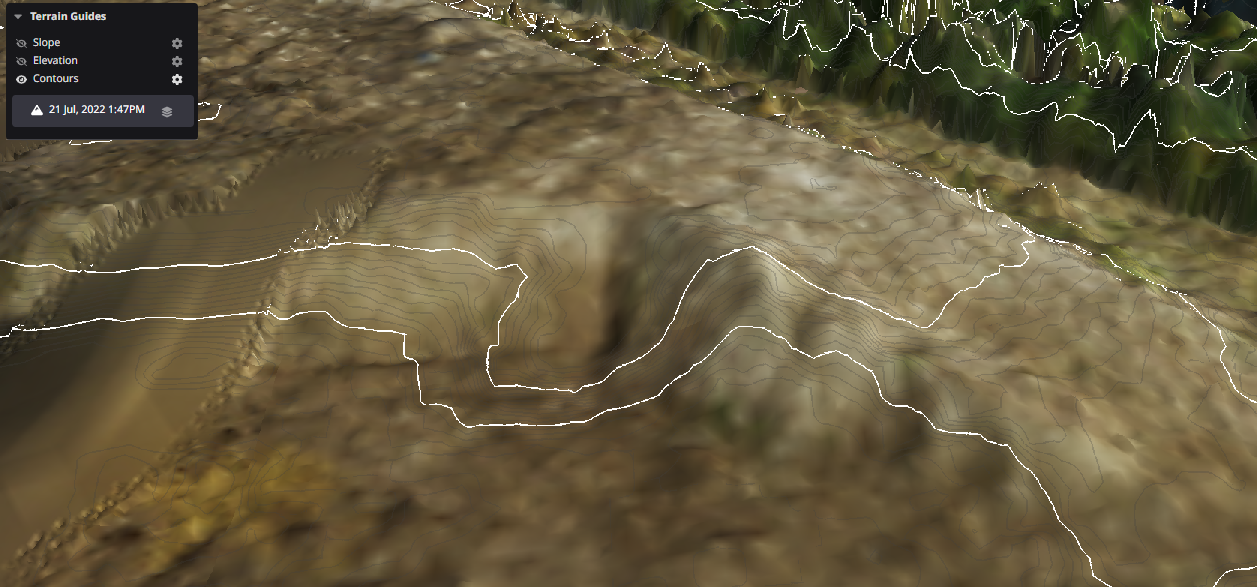
Change contour settings
Selecting the setting button displays the contour lines of the terrain according to the set contour line threshold.
Determines the height of the point cloud data and adds a contour line.
Displays the index contour in white and principal contour in gray.