
|
# |
Content |
Target Function |
Overview |
|
|---|---|---|---|---|
|
1 |
New Features |
Data Layer |
A new 2D blueprint layer has been added to the side panel. If the data you register is in GeoTIFF format, it can be displayed on the project map. It is now possible to register 2D design PDF drawing data in GeoTIFF format as a layer. 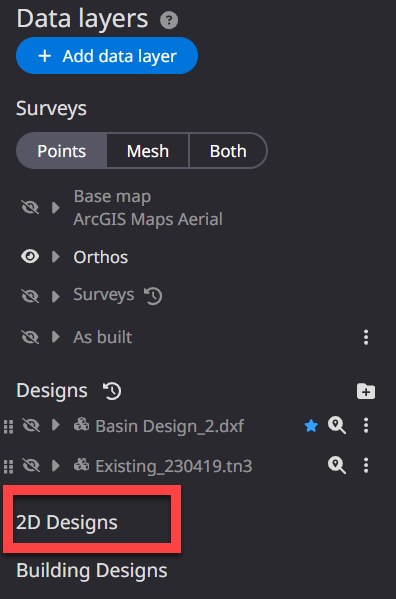
|
|
|
2 |
Improved functions |
Data Layer |
The color scheme for elevation differences in the Project Progress Heatmap can now be freely edited by the user. We have also prepared several gradient presets, allowing users to easily select color schemes. It is now possible to edit the elevation gradient
The gradient in the Project Progress heatmap is now editable. Multiple presets are available, making it easy to set up color schemes.
|
|
|
3 |
defect |
Data Layer |
When registering data on the Dashboard, errors sometimes occurred. This has been improved so that registration is correct. |
|
|
4 |
defect |
Data Layer |
When calculating project progress, the calculation sometimes failed or took a long time to process. Fixed it to work correctly. |
|
|
5 |
defect |
PDF Report |
The scale of annotations in PDF reports was sometimes displayed incorrectly in relation to the actual distance. Fixed to display correctly |
|
|
6 |
defect |
Annotation and Measurement |
When displaying the cut and fill volume calculation results, the heat map was not applied correctly to the annotations. This has been fixed so that it displays correctly. |
|
|
7 |
Improved functions |
3D Icons |
When placing 3D icons, the collision area between icons is now displayed. Icons can now be placed taking into account the actual environment and machine size. 3D icon collision area display function makes it easier to use
You can now display collision areas by clicking "Show Collision Areas" in the 3D Icon menu. A warning will be displayed if collision areas overlap between 3D icons, making it easier to place icons according to the actual size of the construction equipment. (3D icons are not colliding) (3D icons are colliding)
|
|
|
8 |
Improved functions |
Data Layer |
The display of "Progress Management" on the progress heat map has been changed from a gradient display to a clustering display.
Progress heatmap has been changed to clustering display
Changed the progress heatmap from gradient to clustering, which assigns clearer color schemes to each progress percentage tier, making them easier to distinguish. |
|
|
9 |
defect |
Construction Machinery |
When performing remote support for construction equipment, the browser's pop-up blocker was activated and the remote support screen was not displayed correctly. This
|
|
|
10 |
defect |
Data Layer |
There were cases where some construction history data could not be imported correctly into the Dashboard.
|