
|
# |
Content |
Target Function |
Overview |
|---|---|---|---|
|
1 |
New feature |
Data layer |
The following features are now available ”Elevation Gap” heat map for Project’s Progress. When displaying a heat map of project progress, user can now display heat maps by “Elevation Gap”. By expressing the heat map in terms of distance from the target design, user can grasp the progress at a glance. 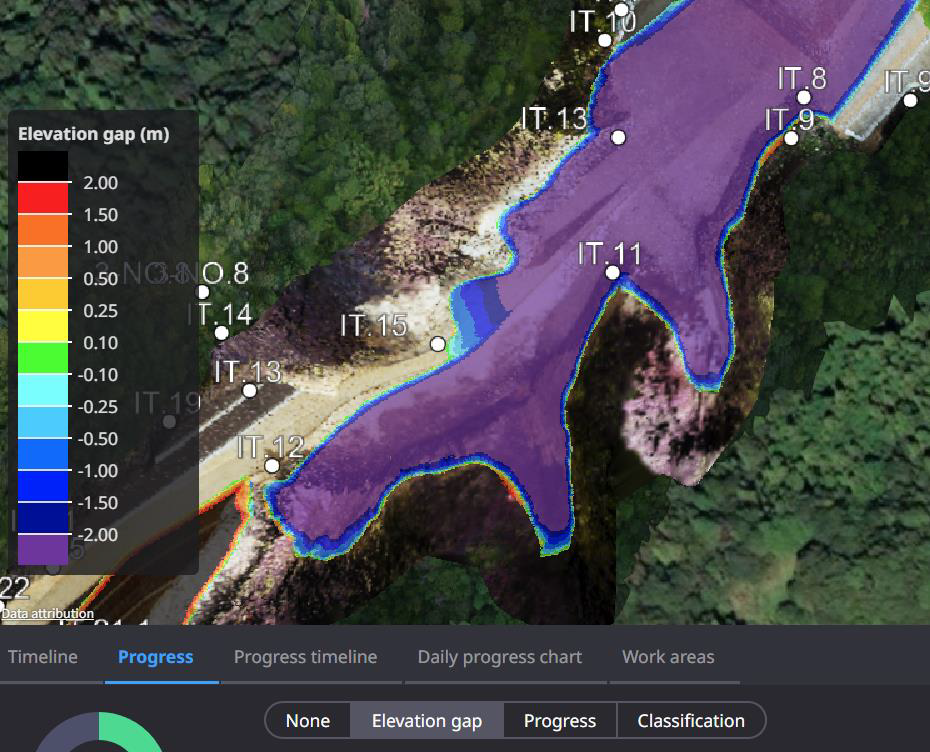
|
|
2 |
Enhancement |
Setting |
When changing the coordinate system of a project, the history of coordinate system managed commonly is now displayed. |
|
3 |
Enhancement |
PDF report |
Stockpile totals can now be tabulated and shown in the PDF report. |
|
4 |
Enhancement |
Data layer |
Changed the initial gradient of the “Progress heat map” and applied the same colors as the Smart Construction application. |
|
5 |
Bug fix |
Data layer |
When registering a 5-digit CSV or Txt file, the data could not be read correctly. This has been corrected so that the data can be imported properly. |
|
7 |
Bug fix |
Measurement |
When calculating Progress by creating annotations from the target design, the results of soil volume calculations were sometimes output slightly larger. This has been corrected so that the correct calculation results are now output. |
|
8 |
Bug fix |
Measurement |
The soil volume settings for Cut & Fill calculation could not be saved correctly. This problem has been corrected and the settings can now be saved properly. |