
On this page:
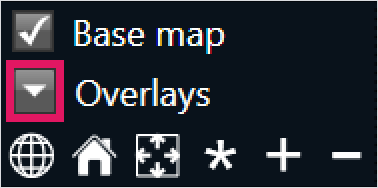
You can manage overlays in the Map Navigator, which appears on the right side of the window whenever the cursor is over the main map. Click the arrow next to Overlays to reveal the complete list.
To enable or disable an overlay, select the check box next to its name.
Some overlays might take time to load due to the volume of data being processed.
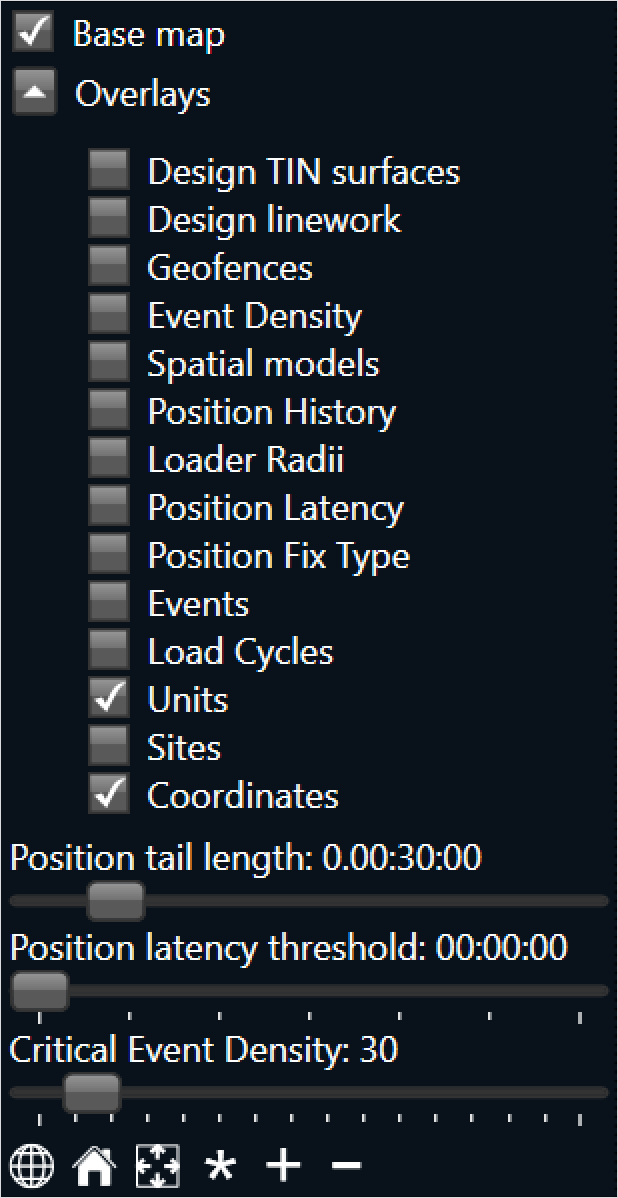
Overlay sliders
Three sliders also display at the bottom of the overlay table: Position tail length, Position latency threshold, and Critical event density. These sliders affect how information is displayed on the iControl map for various overlays.
Position tail length
This configures the duration of position display for machines in the iControl map. For example, if this slider is set to "30 minutes", it will display the machine's movements over the past 30 minutes.
Position latency threshold
This configures which machine positions are displayed based on the latency between when their position was tracked and when it was recorded in the database. For example, if this slider is set to display "2 minutes", only machine positions with a latency of two minutes or more will display.
Critical event density
This configures the colour scheme of the events displayed on the iControl map. For example, if this slider is set to "50", any locations with 50 or more events recorded will display a red mark on the map. However, if the slider is set to "100", only locations with 100 or more events recorded will display a red mark, and so on.