
On this page:
The following map overlays are available in iControl.
Units
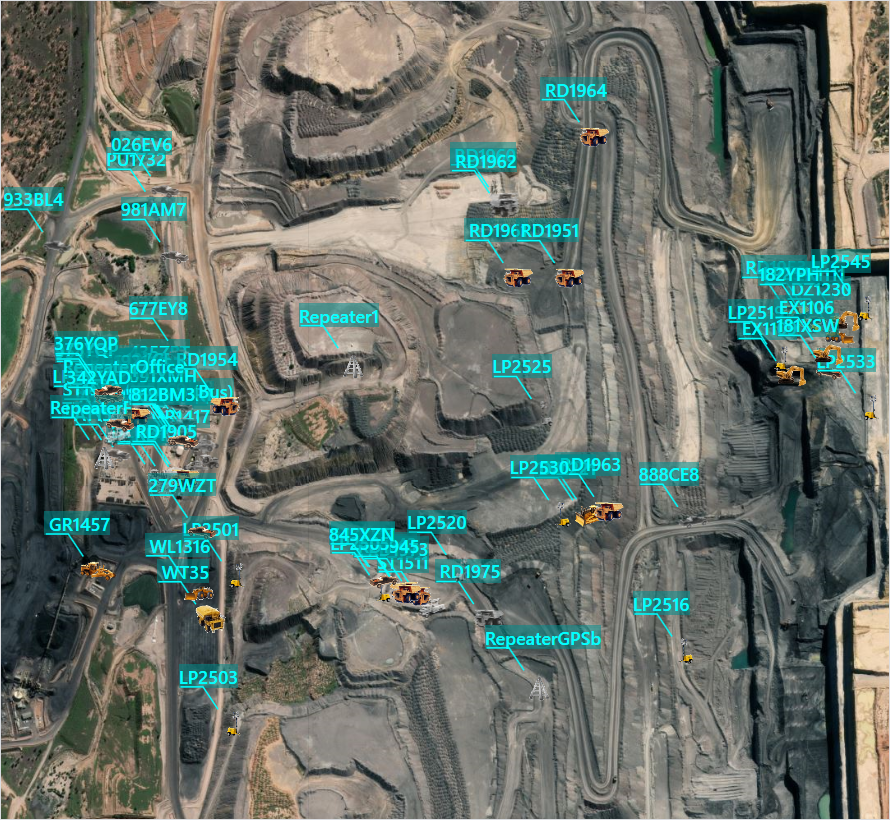
The units overlay displays all vehicles on the map.
Coordinates
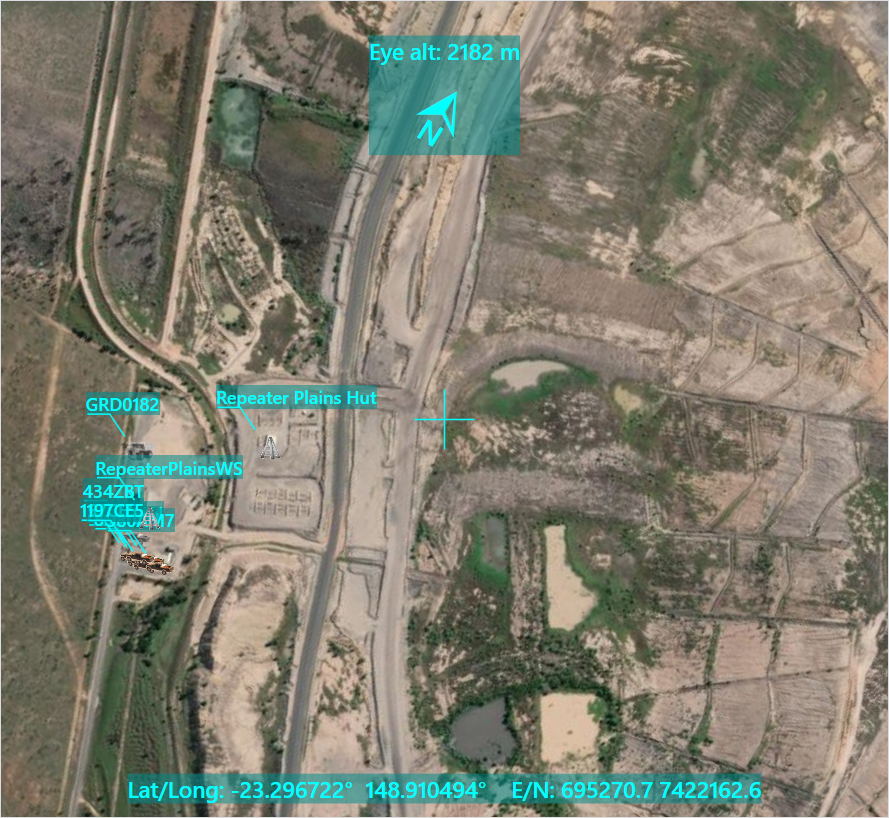
The coordinates overlay displays an eye altitude field at the top of the map, and displays the coordinates of the cursor's current location at the bottom. Also, if the map's orientation has been rotated, the direction of north is overlaid at the top of the map as well.
Geofences
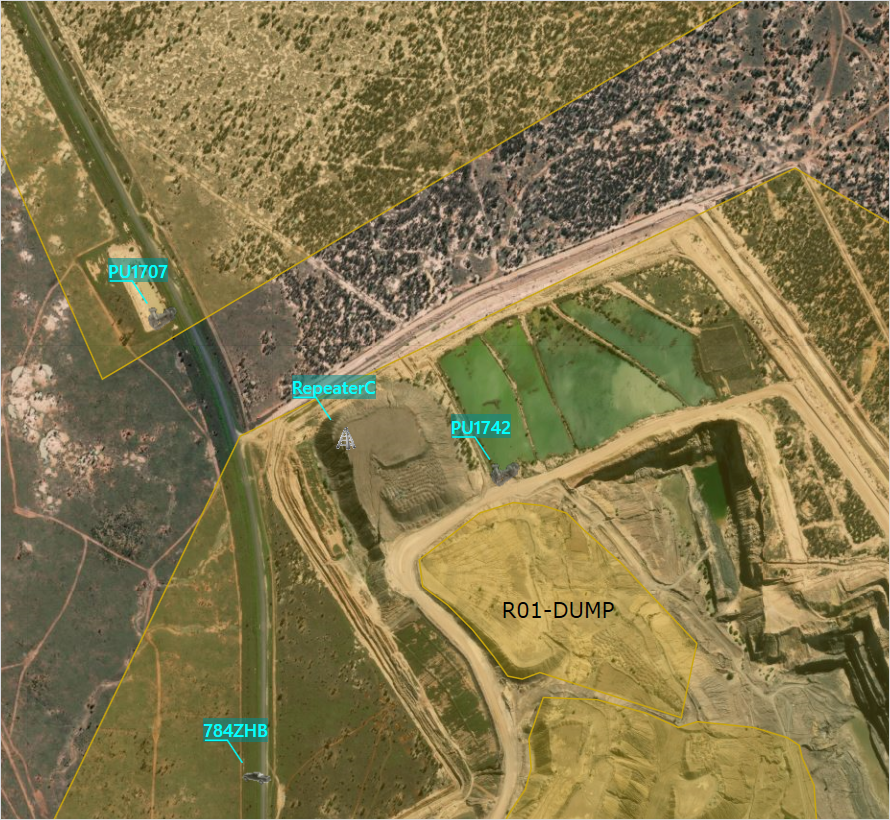
The geofences overlay displays any geofences applied to the site. The geofence colour defaults to yellow, however if a material is assigned to a geofence the fence displays this material's colour instead.
iControl uses geofences to define area boundaries and add structure to the map. Using geofences makes it easier to describe vehicle and load cycle locations.
Design TIN surfaces
The Design TIN surfaces overlay displays a three-dimensional render of the site's designs. Also, if the coordinates overlay is enabled, hovering your mouse over a render displays the design's elevation at the bottom of the screen.
The design file the render is based on must be enabled in the iControl Design files tab for the Design TIN surfaces render to display. This overlay is also only available to sites with iVolve Mine4D Guidance enabled.
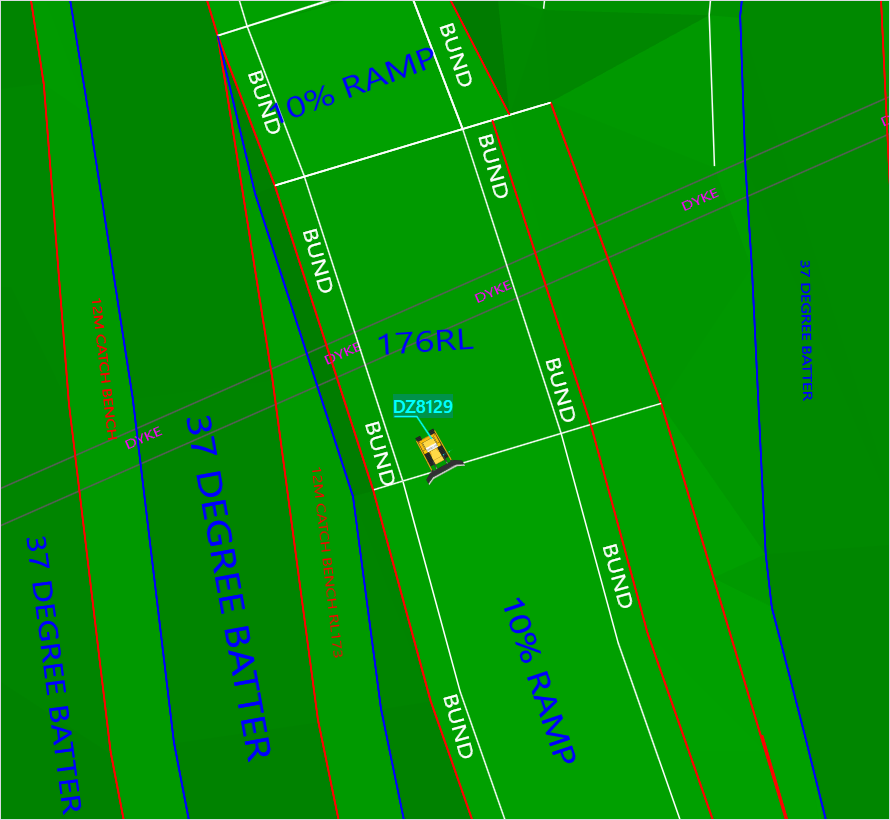
Design linework
The Design linework overlay displays the linework for the site's designs. This overlay can be displayed on its own, but it is recommended you enable the Design TIN surfaces overlay as well to present a clearer picture of the design.
Also, zooming in to a vehicle can provide a clear indication of what its operator sees on their Nexis device as they're working.
The design file the linework is based on must be enabled in the iControl Design files tab for the Design linework render to display. This overlay is also only available to sites with iVolve Mine4D Guidance enabled.
Position history
The Position history overlay traces the paths of every vehicle currently visible for the current shift. This visualisation can highlight roads and any unusual vehicle travel.
iControl assigns a random colour to each device to differentiate position traces; when the vehicle moves in reverse, this is drawn with a transparent trace.
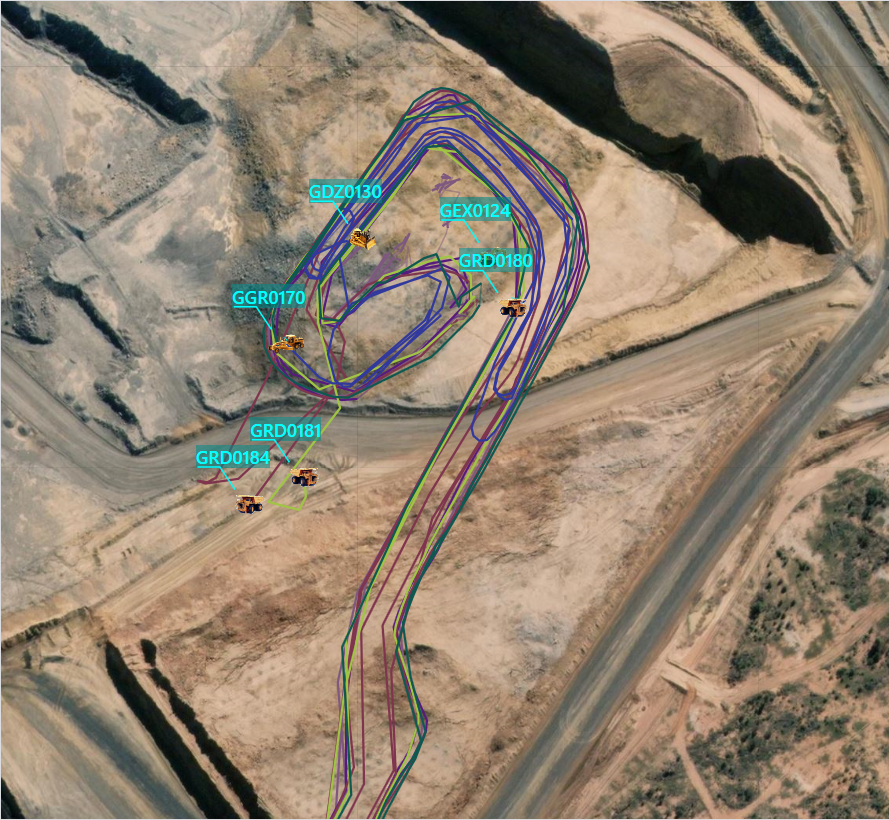
You can hover over a vehicle (or the position trace of a vehicle) to highlight the trace of that vehicle, and click its trace to select the vehicle.
You can also hover over an entity on the timeline (such as a load cycle or an event) to highlight the section of the position trace that corresponds to that entity.
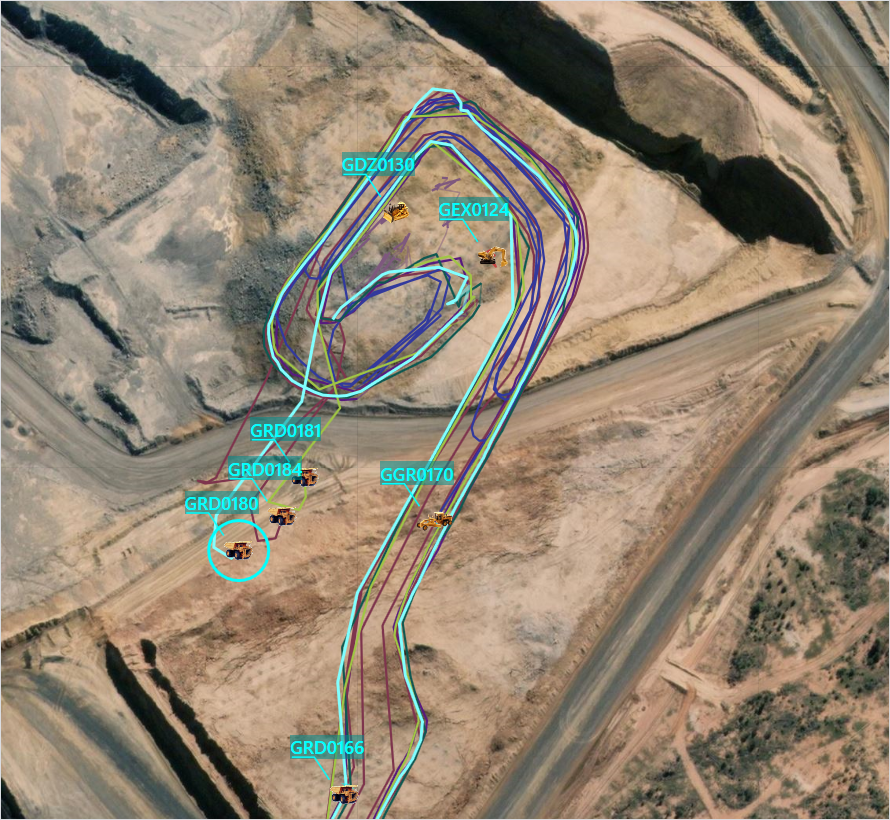
The position trace is drawn point-to-point through each position record reported by a device. Low-precision GPS systems do not always return accurate paths, and can therefore occasionally appear to jump across valleys or up cliffs.
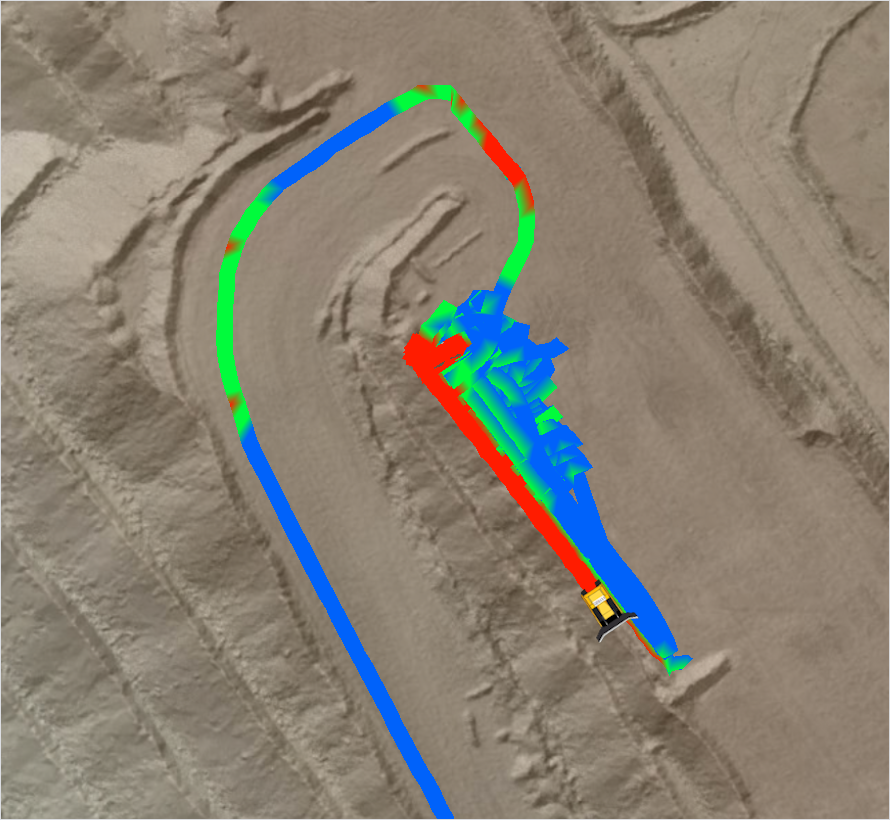
Dozer cut and fill map
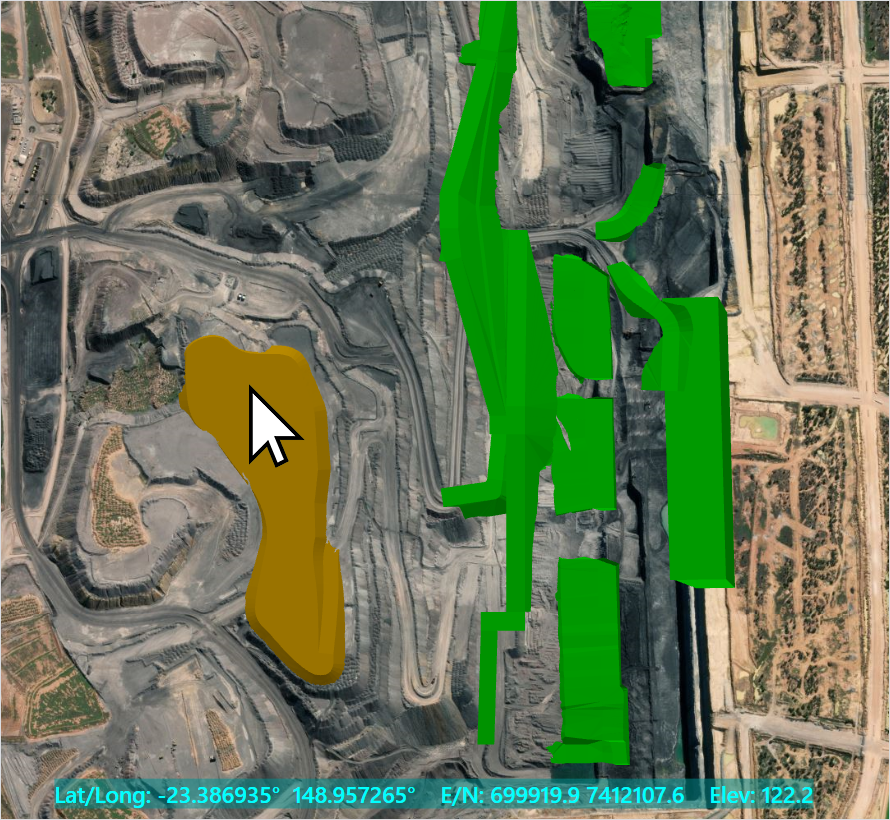
The Dozer cut and fill overlay displays a coloured overlay of the site's design and the site's progress to target.
Each area of the map is coloured green, red, blue, or white. Red areas on site are above the design, blue areas are below the design, green areas are level with the design, and white areas are either outside of the design or there is no RTK fix for the machine.
You must also enable the Design TIN surfaces overlay for the colour scheme to be implemented.
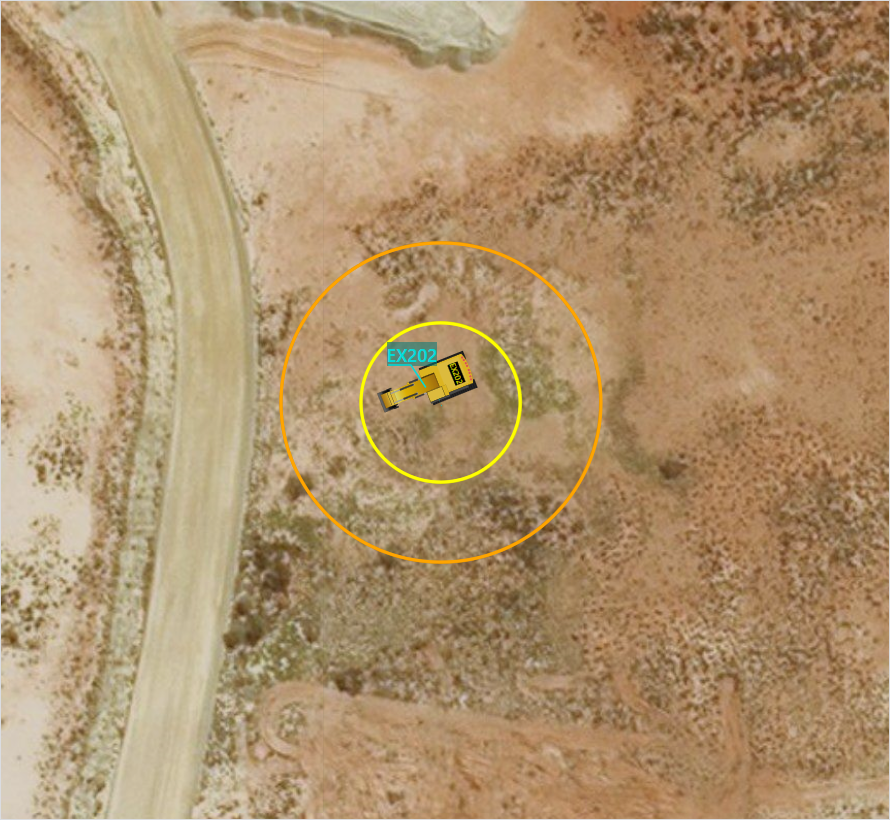
Loader radii
The loader radii overlay displays the loading and queuing radii for each excavator, and are drawn to scale over their current location as follows:
-
A Yellow circle displays the configured loading radius.
-
An Orange circle displays the configured queuing radius.
You can hover over a circle to produce a tool-tip with the following information:
-
"Loading radius of <device name>: ##.#m. Timestamp:<time stamp>", or
-
"Queuing radius of <device name>: ##.#m. Timestamp:<time stamp>".
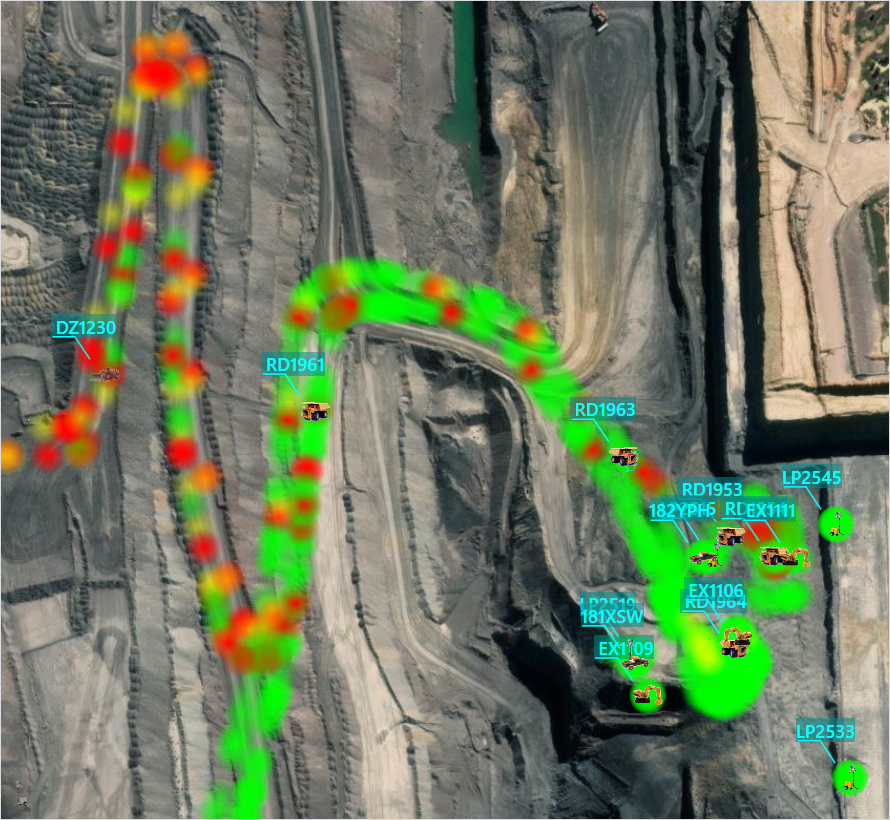
Position latency
The position latency overlay displays a dot at the location of each position record corresponding to the network latency at that time and location as follows:
-
Green represents latency between 0 and 60 seconds.
-
Yellow represents latency between 60 and 300 seconds.
-
Red represents latency greater than 300 seconds.
The position latency overlay can be used to identify dead spots or problem areas in site wireless coverage.
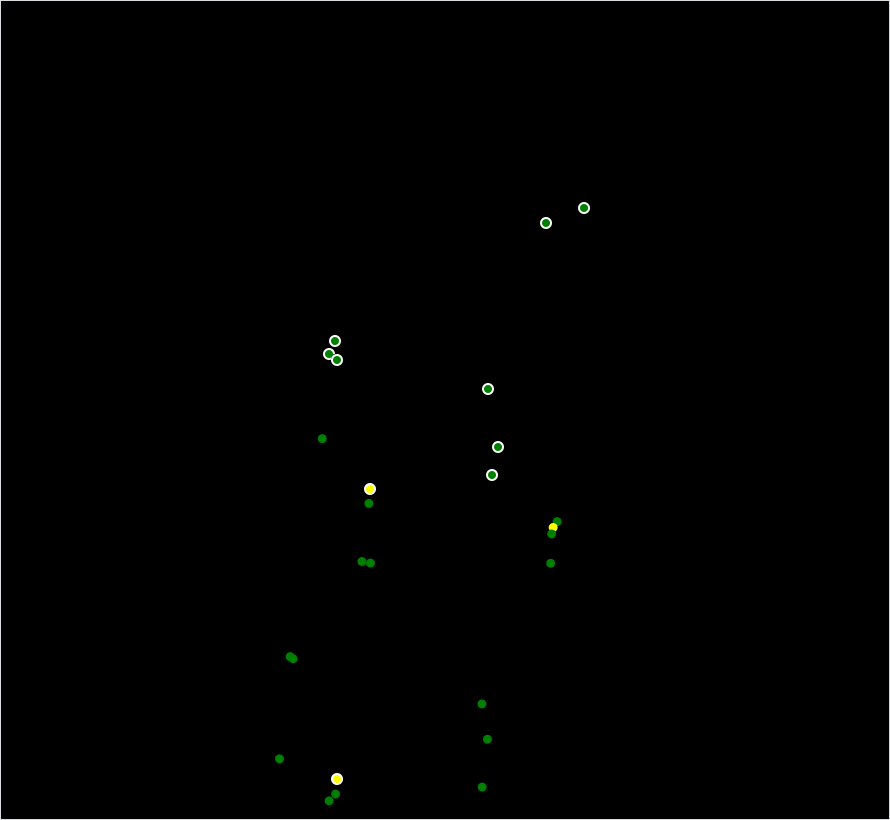
Position fix type
The position fix type overlay displays a coloured circle at the location of each position record. The circle's colour displays the quality of the GPS fix at that time:
-
White - Unknown fix
-
Red - No fix
-
Black - Dead reckoning
-
Yellow - 2D fix
-
Green - 3D fix
-
Blue - Differential fix
-
Violet - RTK float fix
-
Magenta - RTK fix
An outer circle around the position indicates the position was locked. Mine4D can be configured to lock the position when the machine is not moving to prevent GPS wander.
You can hover over an individual circle to display a context menu with the following additional details:
|
Field |
Description |
|---|---|
|
Device |
The device that reported the record. |
|
Easting |
Geographic Cartesian co-ordinate (metres). |
|
Northing |
Geographic Cartesian co-ordinate (metres). |
|
Height |
Elevation (metres). |
|
Heading |
Direction of front of vehicle (degrees). |
|
Track |
Direction of travel (degrees). |
|
Speed |
Ground speed (kilometers per hour). |
|
Fix Type |
Unknown, None, Dead reckoning, 2D, 3D, DGPS, RTK float, RTK. |
|
Lock Type |
Non-zero number if the position was locked. |
|
Timestamp |
Time the position data was captured on device. |
|
Latency |
Time taken for position data to reach the Iris server. |
|
Geofence |
Geofence's name. |
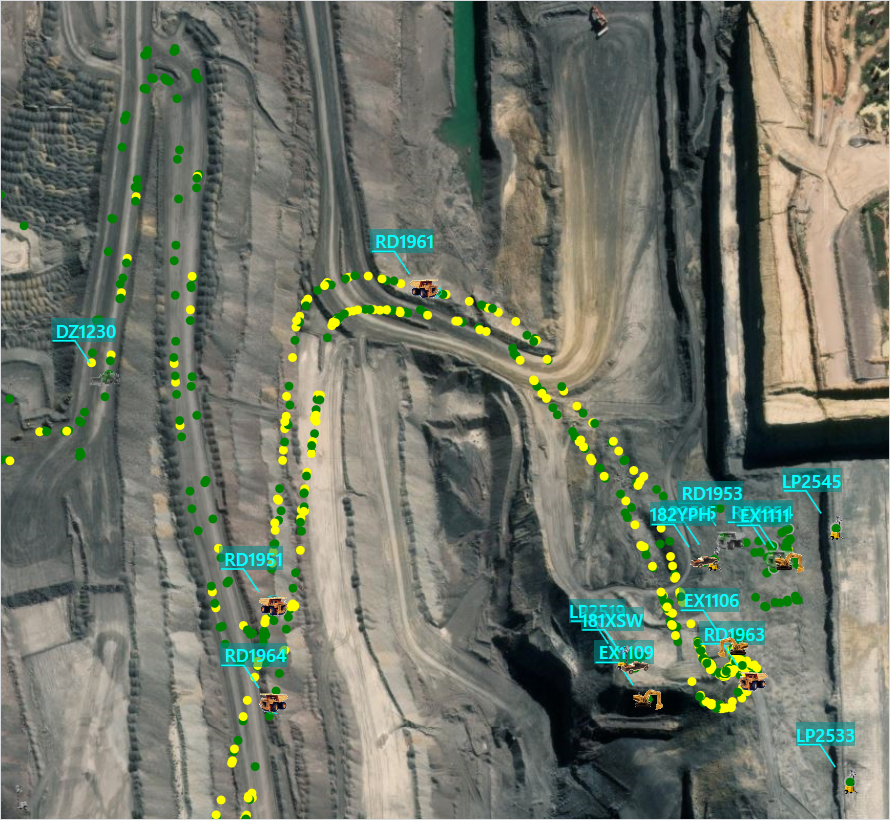
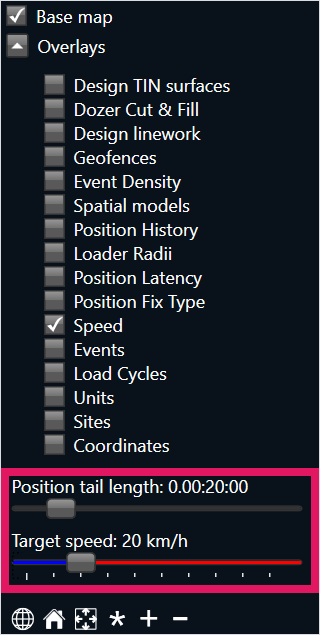
Speed
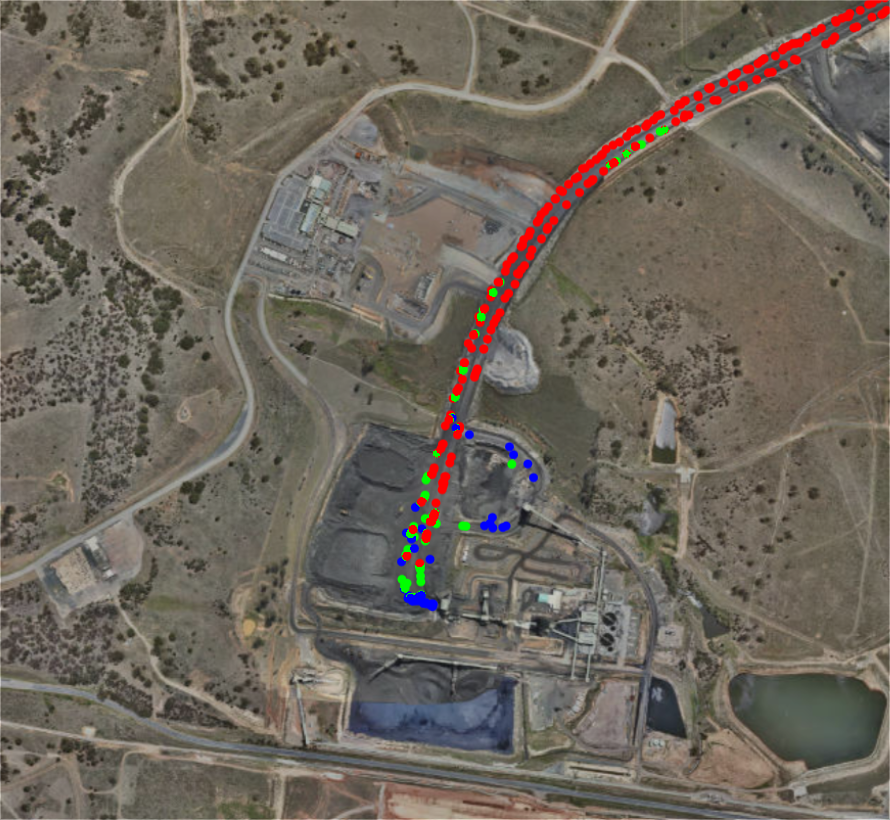
The Speed overlay displays a coloured dot for each position recorded for a vehicle. This can be used to display areas on site where machines are travelling too fast, or too slow.
You can set a target speed for all machines by dragging the Target speed slider left or right, which is located beneath the Overlays list on the right-hand side of the iControl screen.
You cannot set individual target speeds for individual machines, or set targets for a certain machine type. The target speed can only be applied to all machines on site.
However, you can choose the Show Only option to only display selected machines on the map, and the Target speed slider can then be adjusted while your selection is active.
You can also filter position records by when they were recorded with the Position tail length slider. For example, in the image below the Position tail length slider is set to 20 minutes; any position records recorded more than 20 minutes ago (such as a machine position recorded 30 minutes ago) will not be displayed.
Each dot displays one of the three following colours:
-
Blue - The machine is travelling below the target speed.
-
Green - The machine is travelling within the target speed.
-
Red - The machine is travelling above the target speed.
There is a 5 km/h threshold above and below the target speed. For example, if the target speed is 20 km/h, a speed of anywhere between 15 km/h and 25 km/h will also display a green dot.
Further, this threshold is only tracked in kilometers per hour, not miles per hour, even if your site records speeds in miles. A 5 km/h threshold is equal to roughly 3 mph.
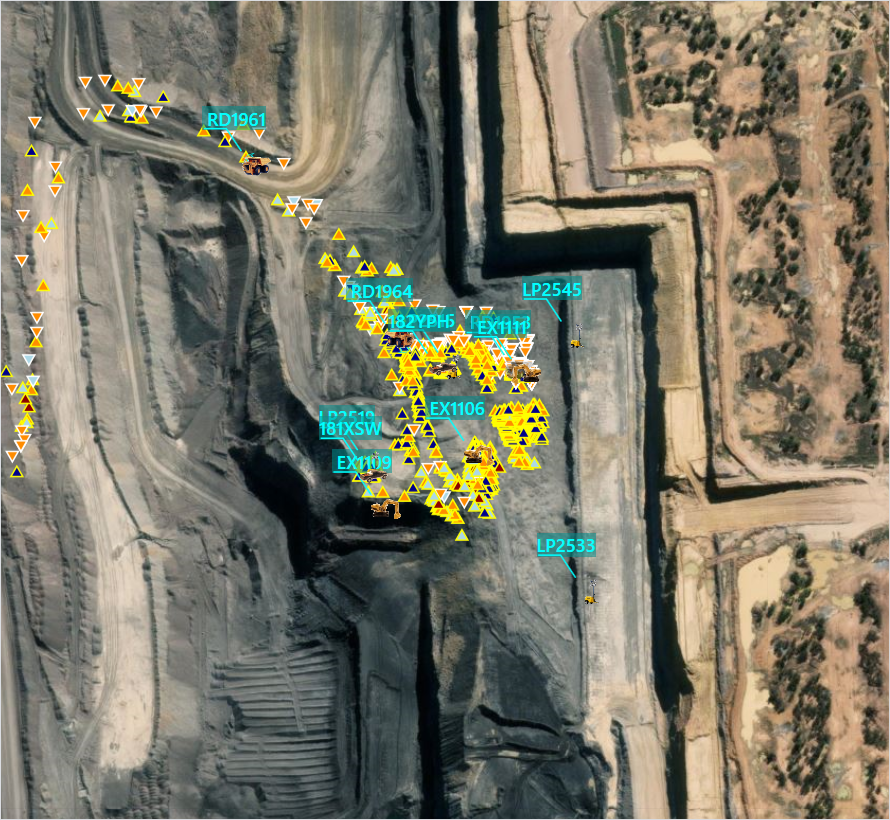
Events
The events overlay displays a triangle with a white border at the start location for each Mine4D event in the current shift.
The Events overlay can display all events at a site, however you can also apply filters to display only certain events on the iControl map and timeline.
Colours are set as follows:
-
Blue - Low severity event.
-
Orange - High severity event.
-
Red - Urgent severity event.
You can hover over an event to highlight it in light blue, and draw a line to the event's previously-hidden end location. An end location is drawn as a circle with the same colour as the triangle.
A tool-tip also appears, providing the following event details:
|
Field |
Description |
|---|---|
|
Device |
The device that reported the event. |
|
Description |
Name of the event. |
|
Severity |
Low, High or Urgent. |
|
Value |
An OEM-specified event value. |
|
Start |
Start date and time for the event. |
|
End |
End date and time for the event. |
|
Duration |
Duration of the event on the device. |
|
Finished |
True or False. |
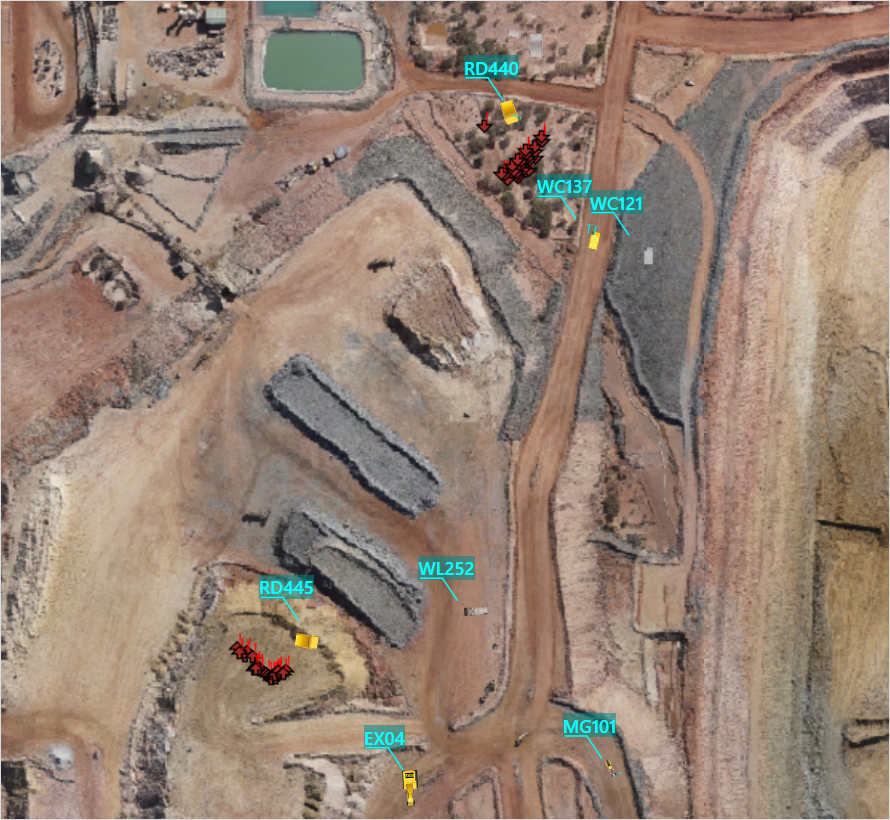
Load cycles
The load cycles overlay is only available for sites with iVolve Mine4D Production. This overlay does not display any data for other sites.
The Load cycle overlay displays load (up arrow) and dump (down arrow) locations for the shift. Arrow colours are assigned to match the hauled material type.
You can hover over a load location to highlight it in light blue and draw a line to the cycle's previously-hidden dump location.
The end location is drawn as a down arrow with the same colour as the up arrow. A tool-tip also appears, providing the following cycle details:
|
Field |
Description |
|---|---|
|
Truck |
The truck that reported the cycle. |
|
Loader |
The load paired with the truck for this cycle. |
|
Material |
The material selected by the paired loader. |
|
Payload |
The total tonnage reported by the truck weighing system. |
|
Start Time |
Load cycle start time (the dump time of the previous cycle). |
|
Load Time |
Timestamp for the last pass made during loading. |
|
Dump Time |
Dump time as reported by OEM machine. |
|
Load Duration |
Amount of time taken to load truck. |
|
Fuel Used |
Litres of fuel burned during cycle (if available). |
|
Latency |
Time taken for position data to reach the Iris server. |