
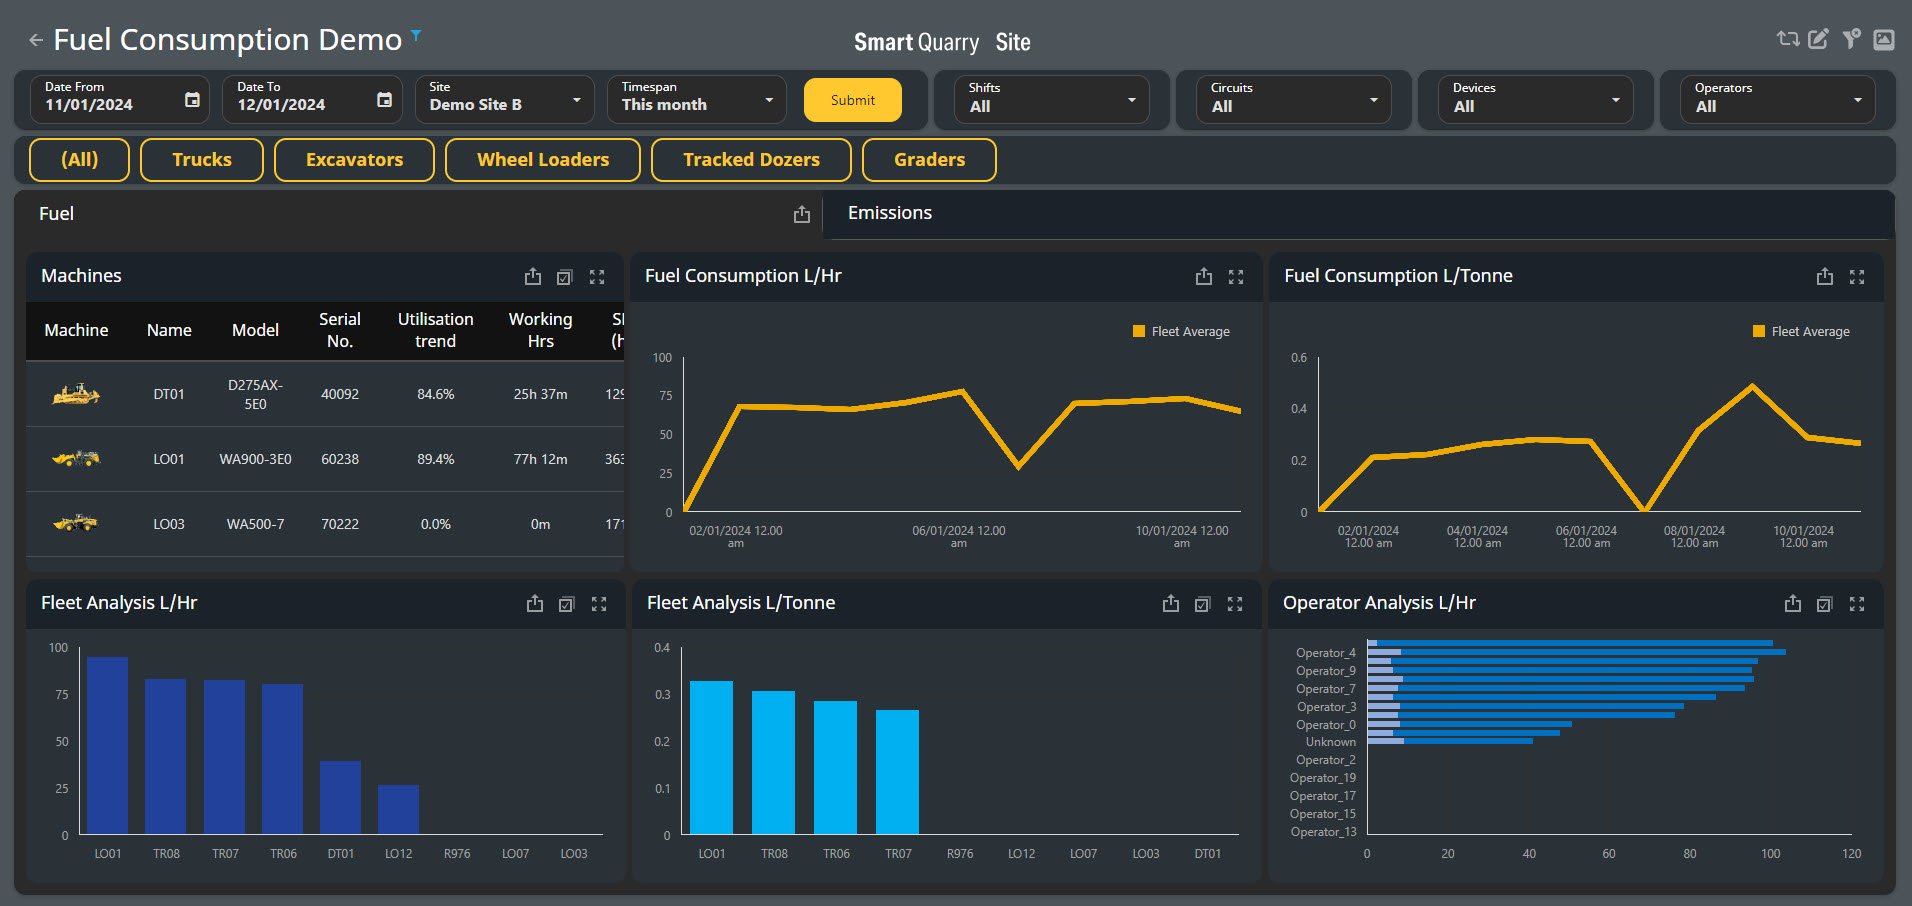
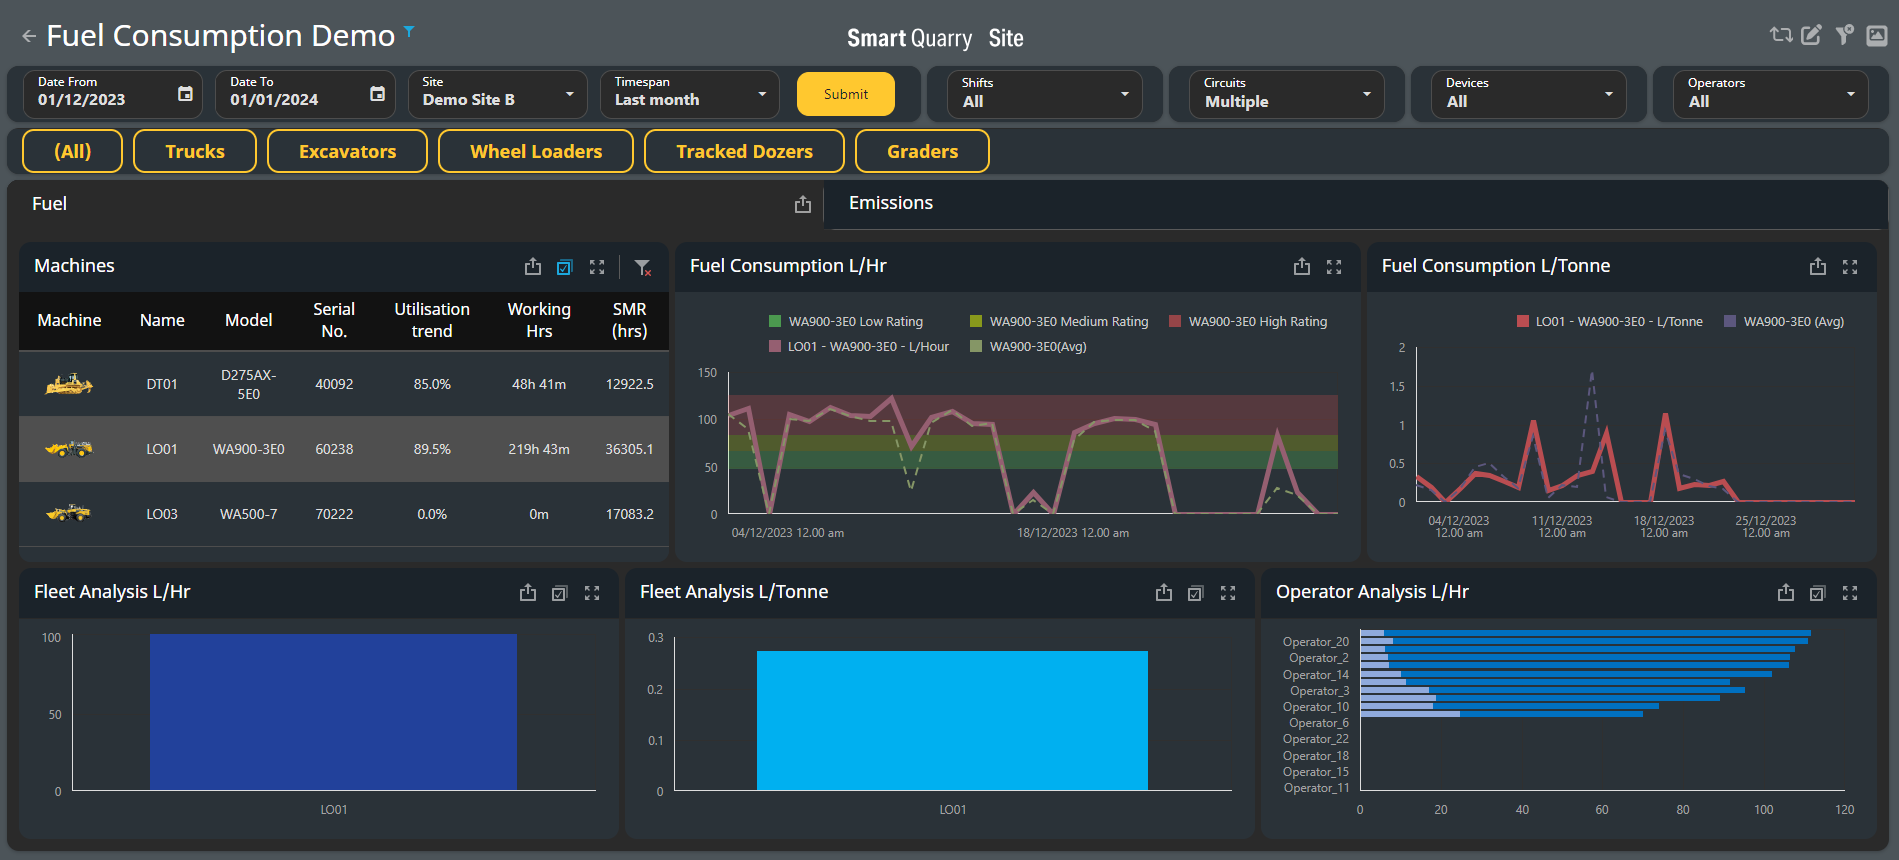
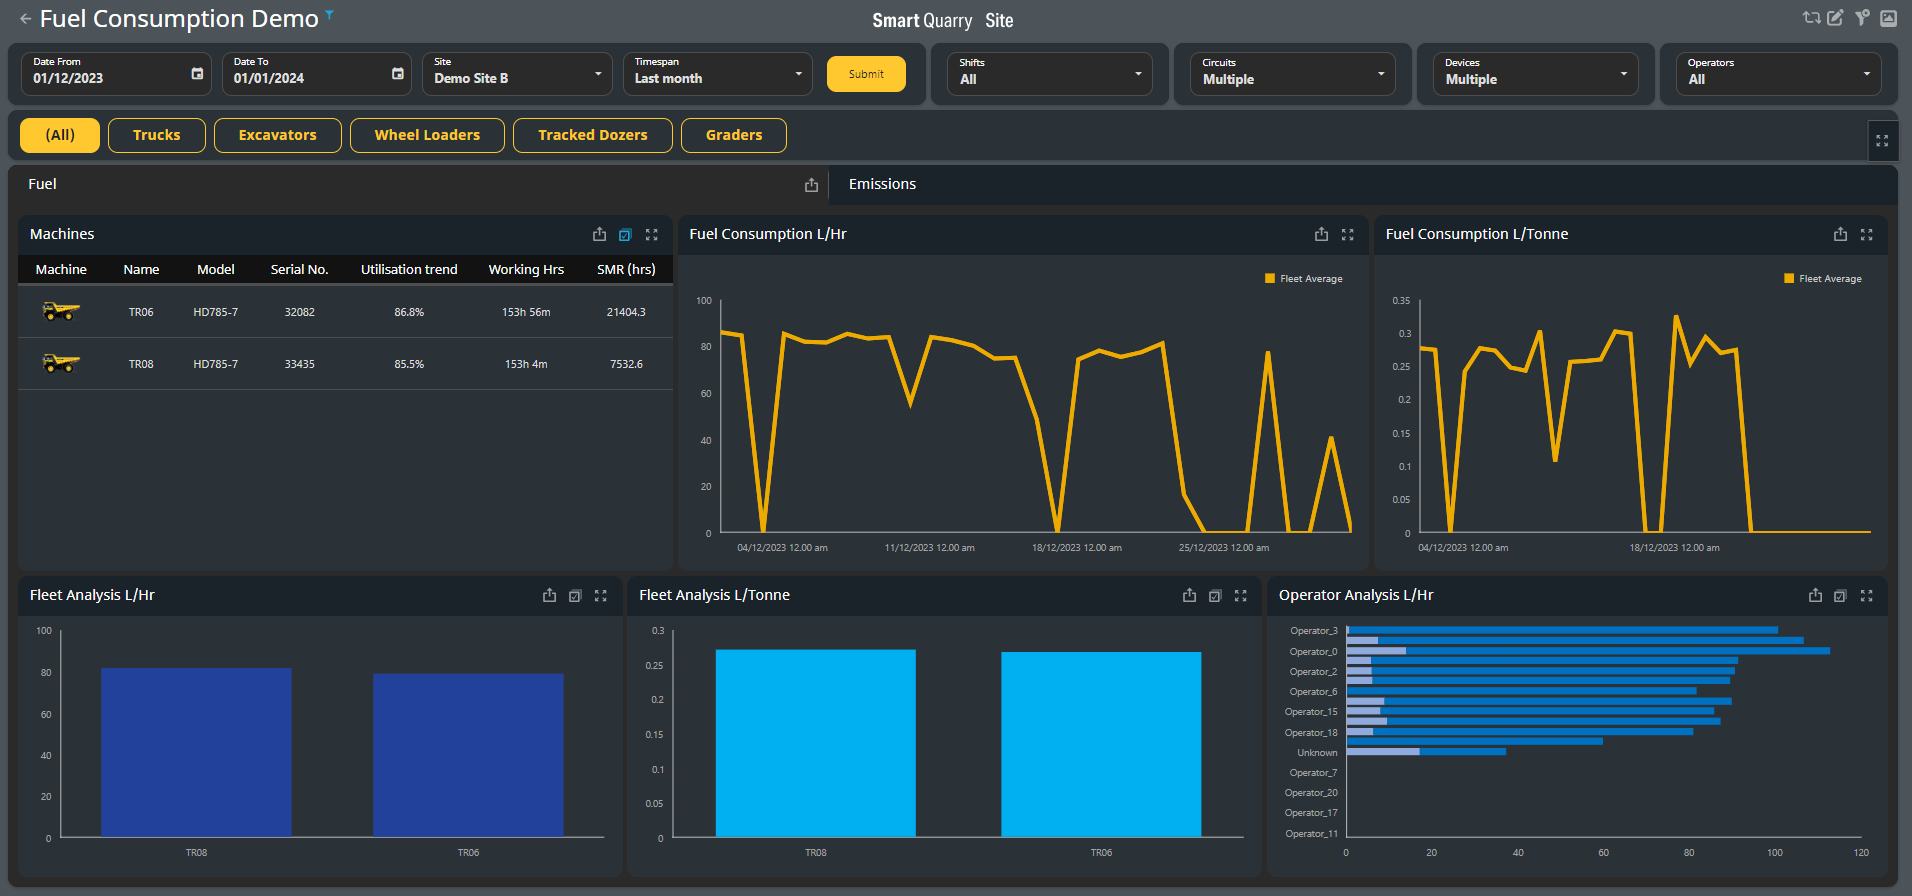
You can use the Fuel Consumption dashboard to monitor the fuel efficiency, ESG activity of your connect SQS fleet. You can compare models, machine types, haul circuits, material and material type or even individual trucks or operators.
Reporting and measuring your carbon footprint based on actual work being completed
Fuel Consumption Table Of Contents
You can use the filters in the top bar of the Fuel Consumption dashboard to display only data for a given date, time-period, or predefined time span. You can also filter the data to focus on specific shifts, circuits, devices, operators, or machine types.

Using the Machines Table
-
The Machines table displays relevant information for each machine in the fleet that has data in the selected time-period
-
To adjust what information the Machines table displays, use the filters at the top of the dashboard or select a parameter in one of the other tables or charts:
-
Fleet Analysis L/Hr chart
-
Fleet Analysis L/Tonne chart
-
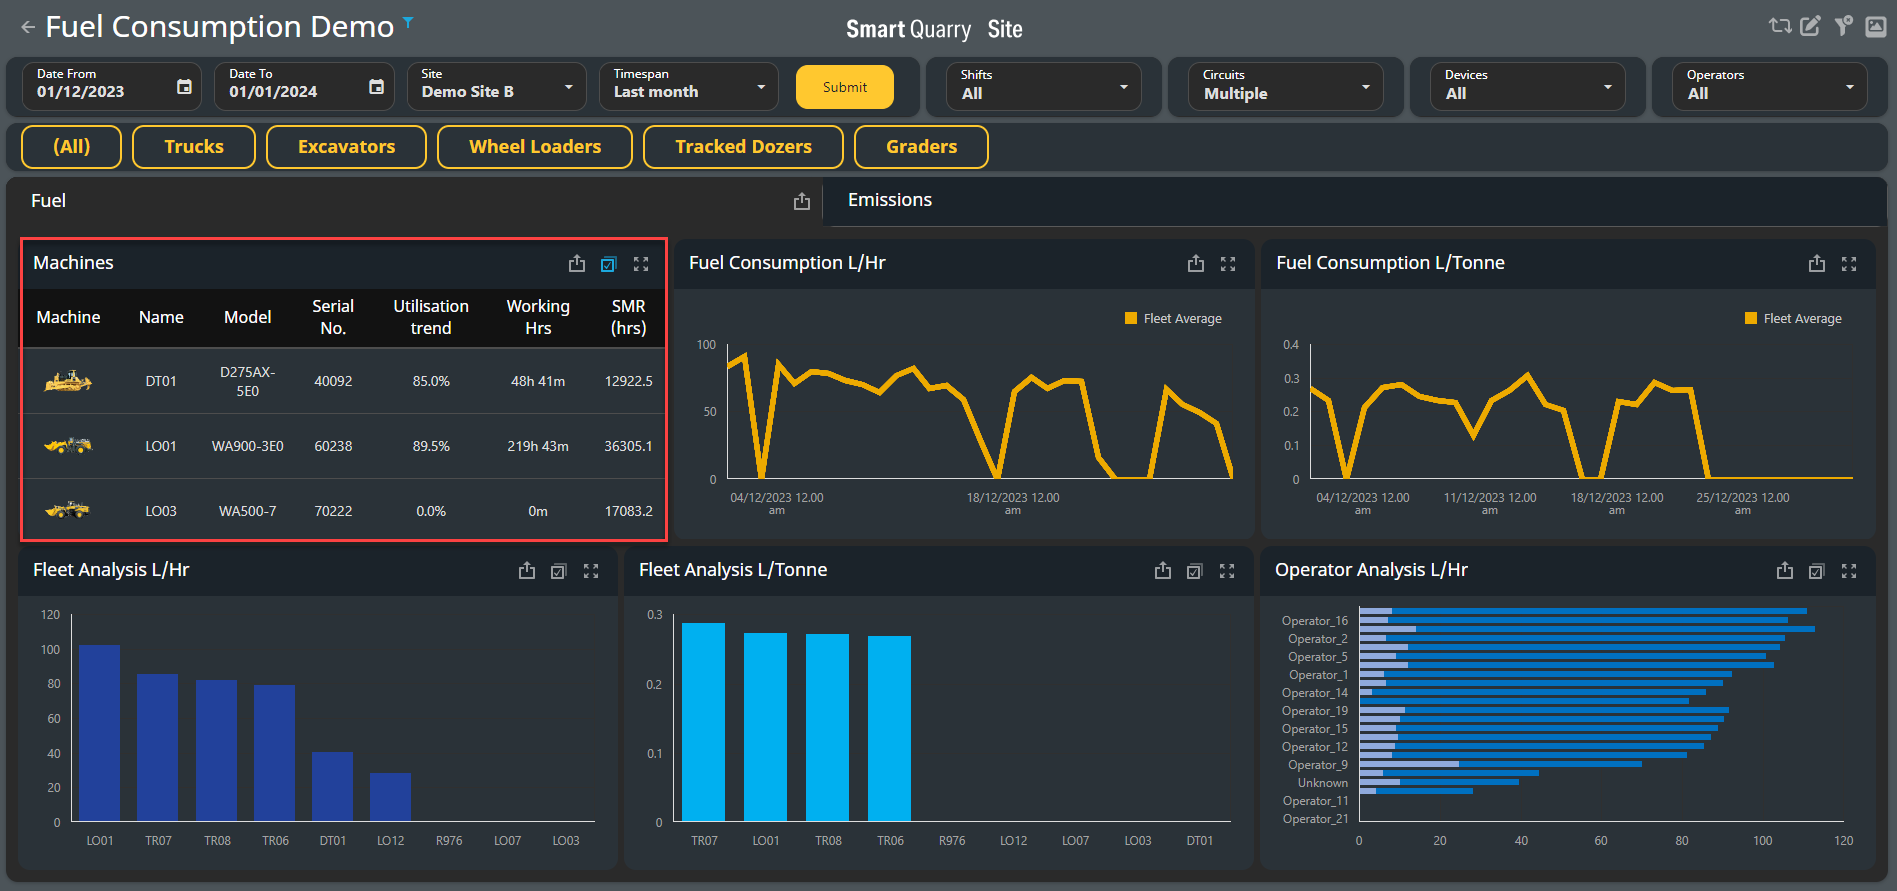
To use the Machines table to filter what the dashboard displays, select the row in the table for the machine you want to investigate. The entire dashboard shows only the statistics for the selected machine.
To deselect the machine, select the Clear Master Filter button
check article on clearing master filter here: https://smartconstruction.atlassian.net/l/cp/qgiVEmk6
-
To select multiple machines, first select the Multi-Select button, then select the relevant machines in the table. The dashboard updates to display information about the selected machines only
To deselect the machine, select the Clear Master Filter button
check article on clearing master filert here: https://smartconstruction.atlassian.net/l/cp/qgiVEmk6
Using the Fuel Consumption charts
-
The Fuel Consumption charts display relevant fuel consumption information for the fleet for the selected time-period.
-
When no machines are selected, the Fuel Consumption charts show the average fuel consumption for the entire fleet.
-
To adjust what information the Fuel Consumption charts display, use the filters at the top of the dashboard or make a selection in one of the other tables or charts:
-
Machines table
-
Fleet Analysis L/Hr chart
-
Fleet Analysis L/Tonne chart
-
Operator Analysis chart
The Fleet Analysis L/Tonne chart displays data only for vehicles that moved production material (not waste) for the selected time span.
Viewing Fuel Consumption for Specific Machines Using the Machines Table
-
When you make a selection in the Machines table, the Fuel Consumption charts update to display related information.
-
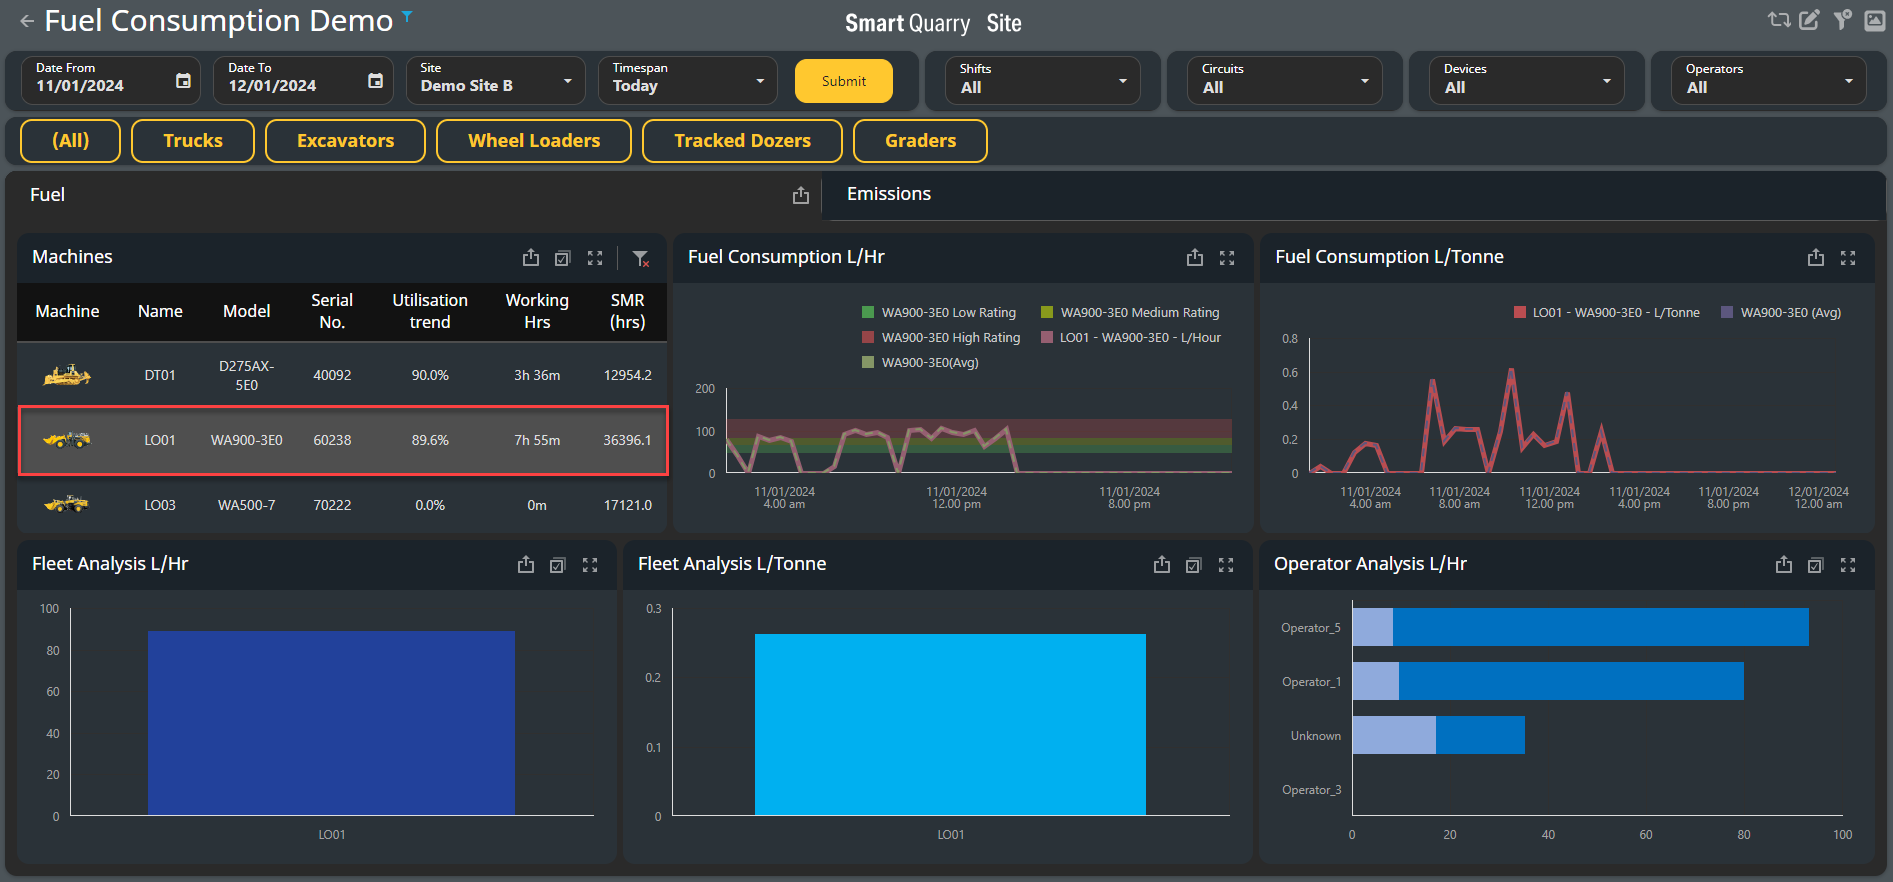
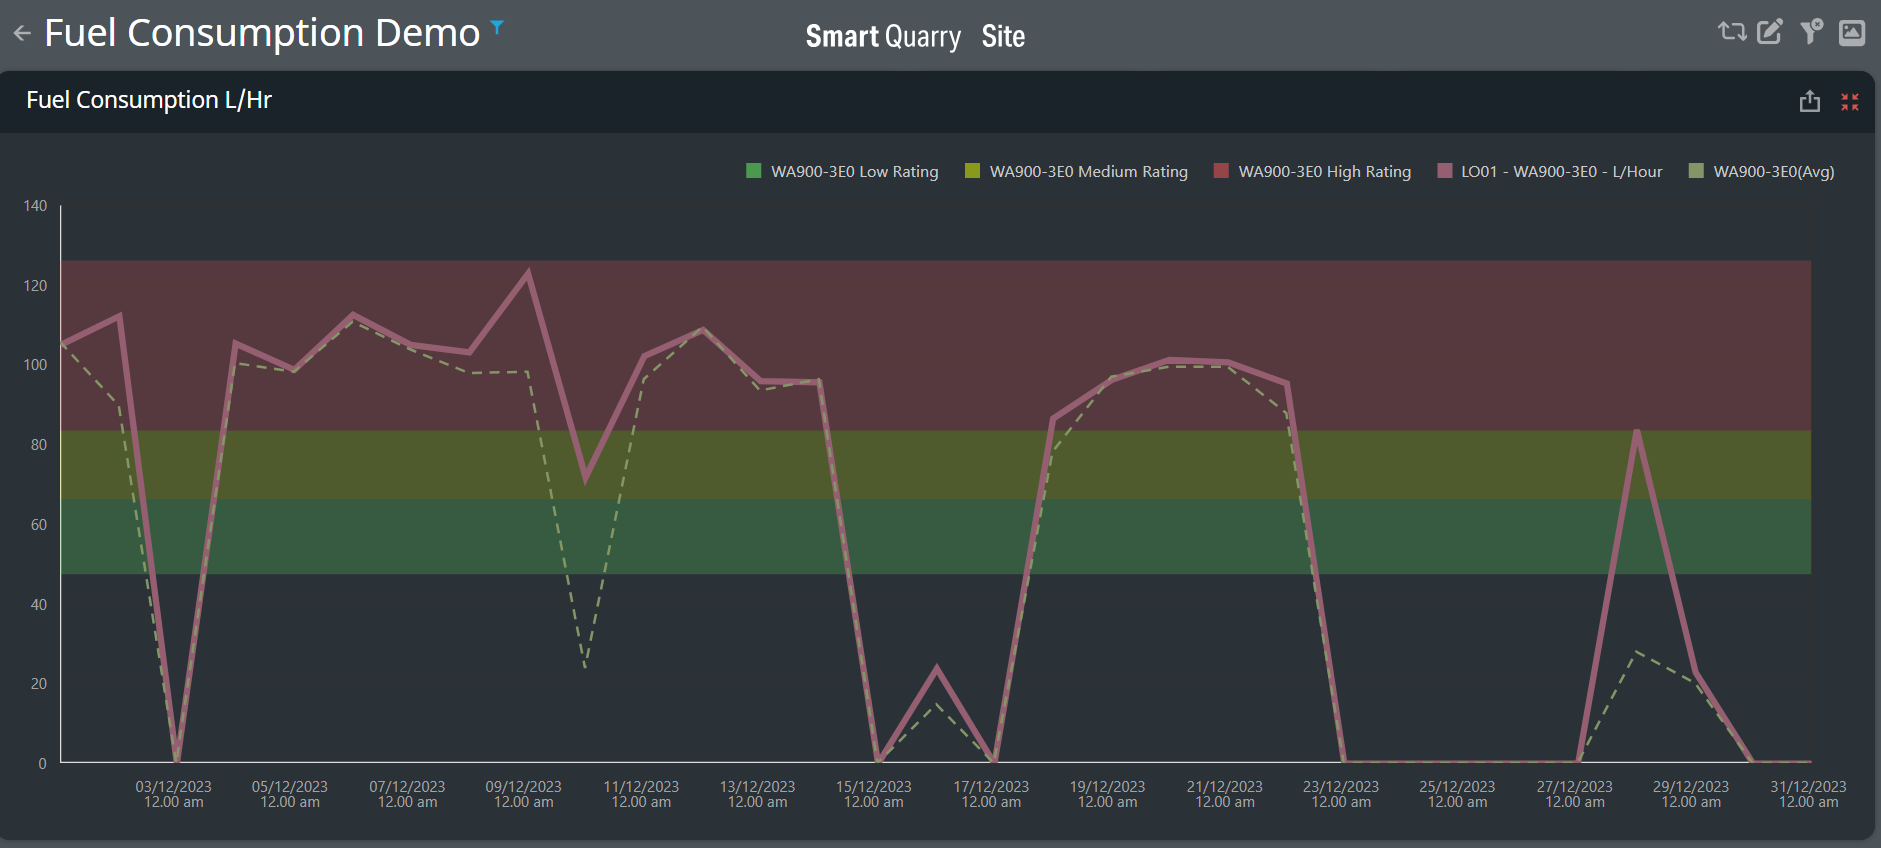
When you select a single vehicle in the Machines table, the fleet average is hidden, and the Fuel Consumption L/Hr chart instead displays the following information:
High [RED], medium [YELLOW], and low [GREEN] fuel consumption ranges for the model of the selected vehicle, as colour-coded background bars. These ranges are defined by the vehicle manufacturer.
-
Total fuel consumption in litres per hour (L/Hr) used by the selected vehicle, as a solid line
-
The average fuel consumption of all vehicles of the same model, as a dotted line.
In the example Above and Below, the selected vehicle LO01 is a WA900-3E0 Wheel Loader, so the dotted line represents the average of all WA900-3E0 Loaders at the site. The red, yellow, and green ratings on the Fuel Consumption L/Hr chart are for WA900-3E0 trucks, as Defined by Komatsu
-
1If you select two or more vehicles of the same model, the Fuel Consumption charts display a single dotted line as the vehicles share the same average fuel consumption given that they are the same model.
-
In the example below, TR06, TR07 and TR08 are all HD785-7 models, so when they are selected the fuel consumption ratings remain and the single fuel consumption average line for HD785-7 models represents all trucks.
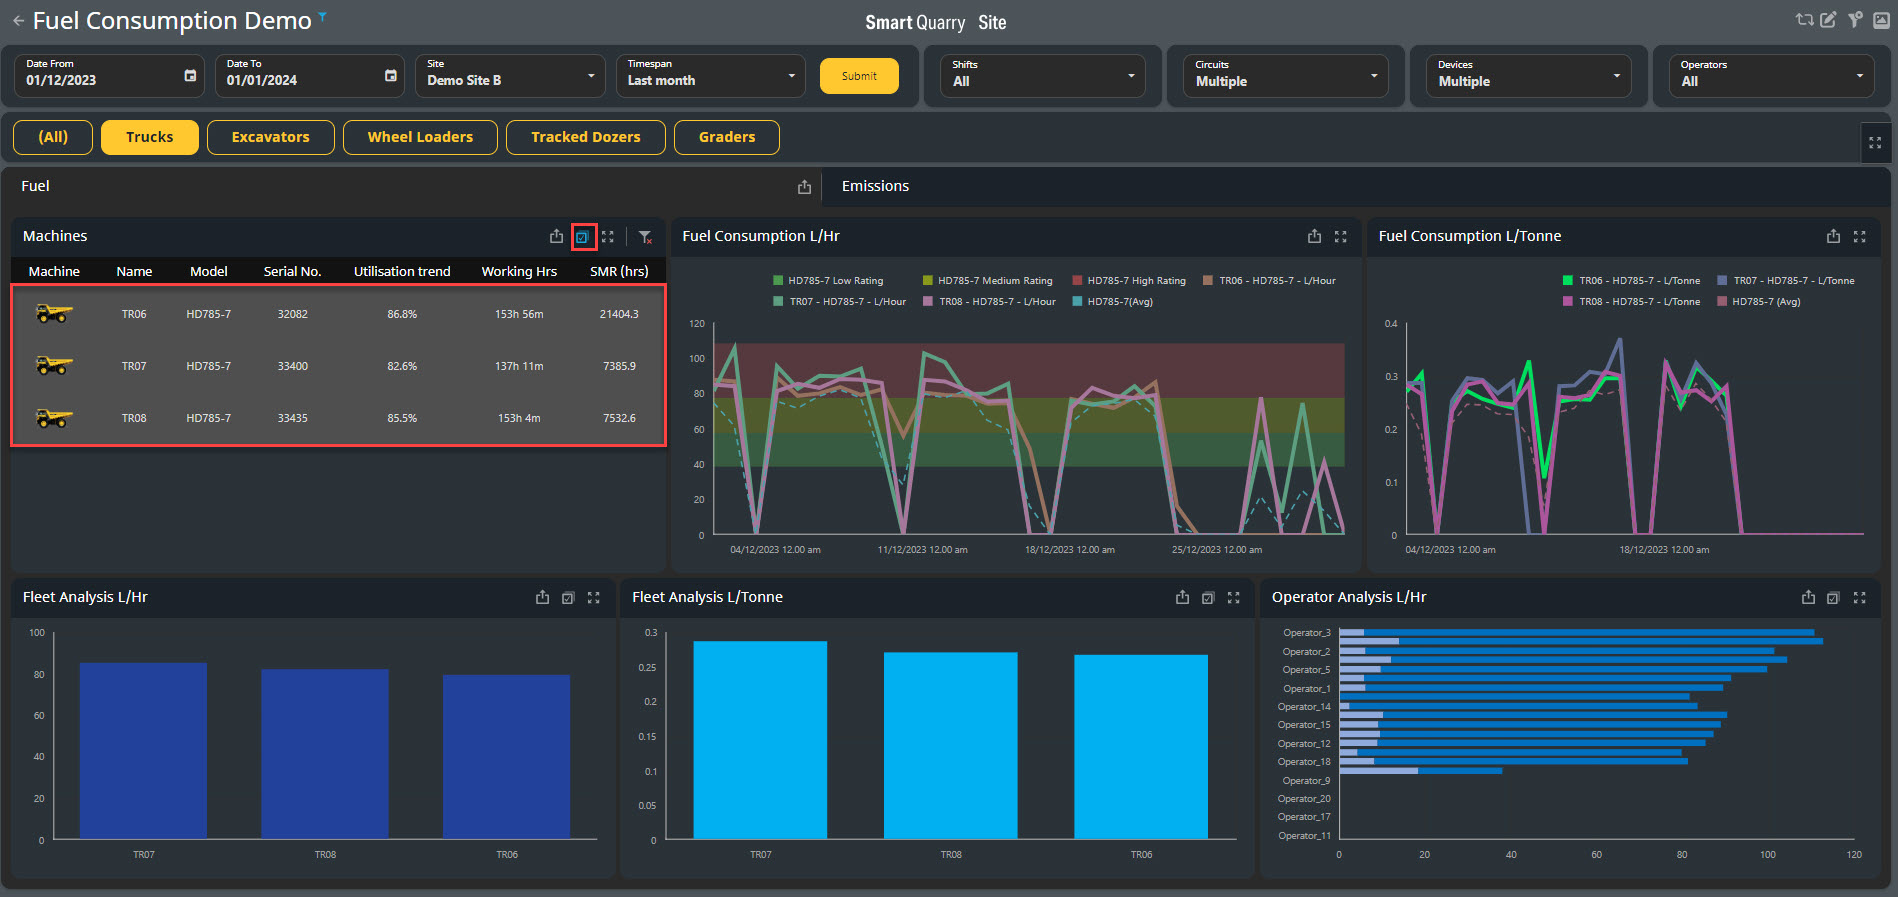
The fuel consumption ratings are only shown when you select a single vehicle or select multiple vehicles of the same model.
-
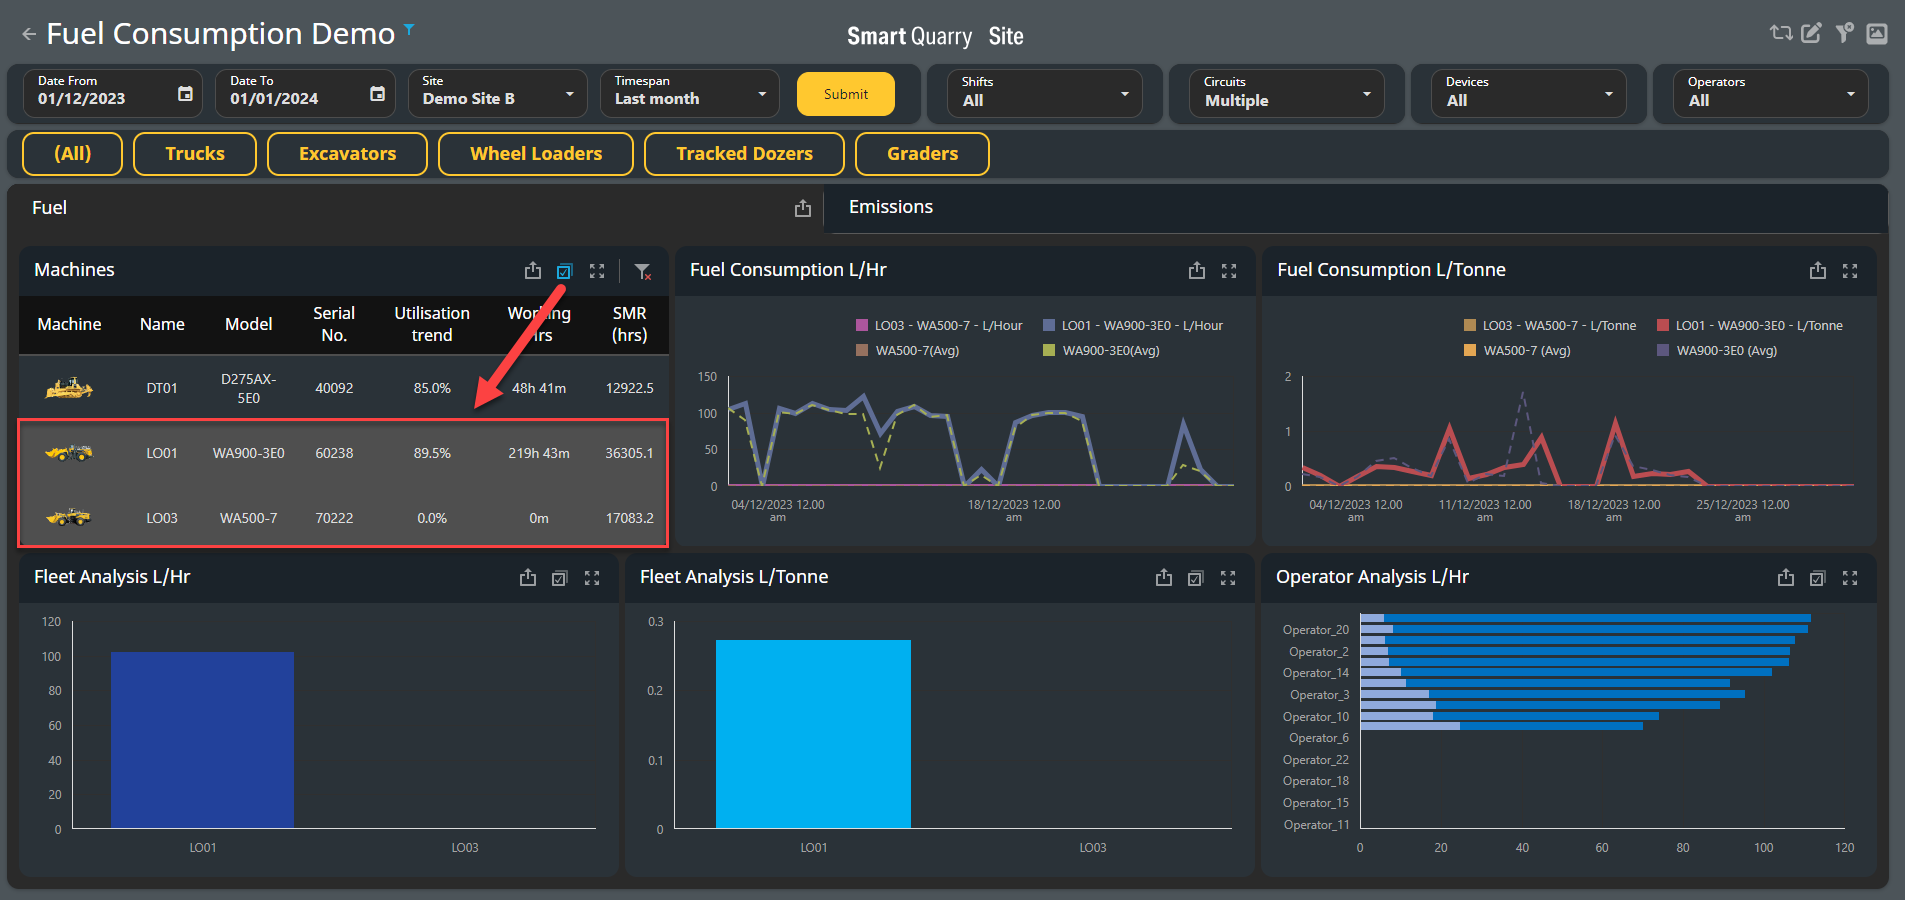
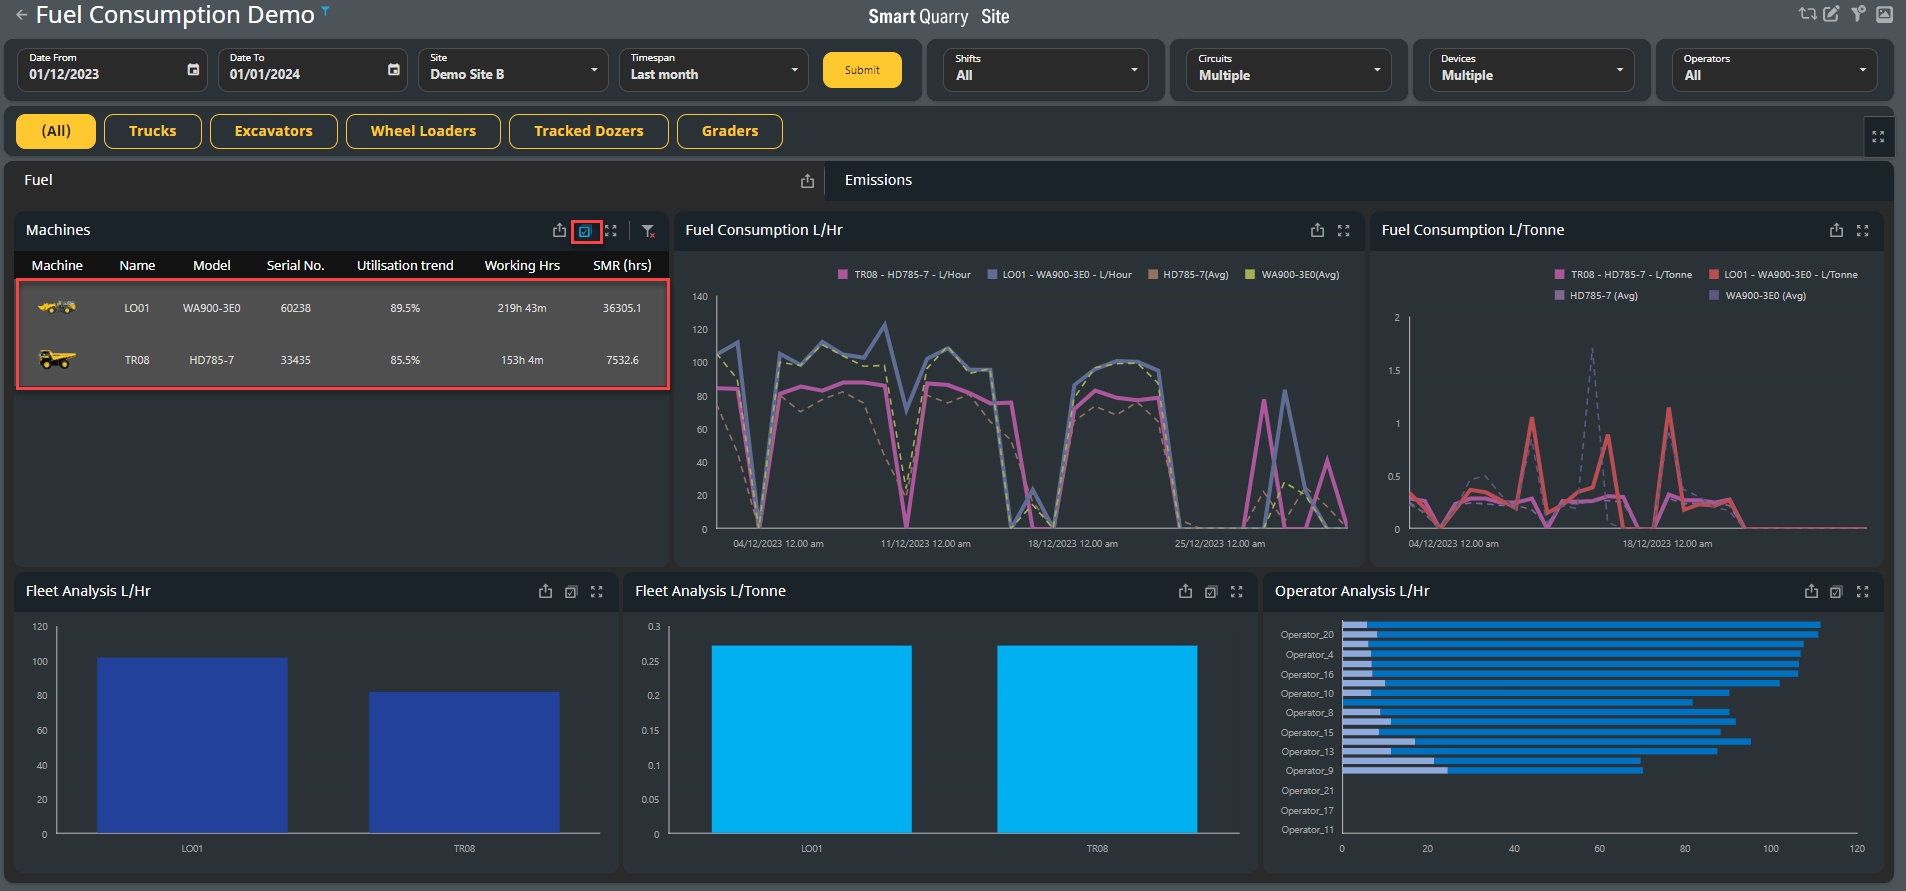
If you select two or more vehicles of different models, the fuel consumption rating ranges are hidden. The Fuel Consumption L/Hr chart displays only the following information:
-
The total fuel consumption lines for each vehicle.
-
The average lines for each of the selected vehicles' vehicle models. The legend indicates which dotted line represents which vehicle model.
In the example below, LO01 and TR08 are different model loaders, so when they are selected the fuel consumption ratings disappear and fuel consumption average lines for each model appear in the Fuel Consumption chart
Viewing Fuel Consumption for Specific Machines Using The Fleet Analysis Charts
-
When you make a selection in the Fleet Analysis charts.
-
Fleet Analysis L/Hr, or
-
Fleet Analysis L/Tonne
The Fuel Consumption charts update to display related information.
-
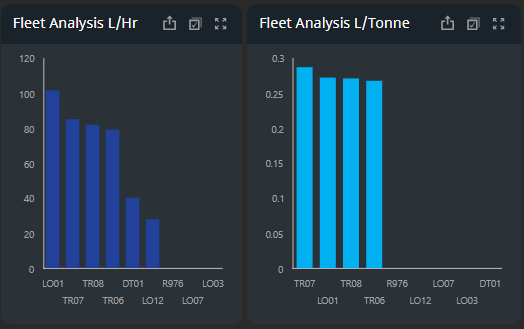
To use the Fleet Analysis charts to filter what the dashboard displays, select a vehicle's associated bar in one of the Fleet Analysis charts to filter the entire dashboard on that vehicle and show only its statistics.

To select multiple vehicles, first select the Multi-Select button, then select the relevant vehicles' bars. When Multi-Select is active, you can deselect vehicles by clicking on their bars a second time.
In the below example, TR06 and TR08 are selected in the Fleet Analysis L/Hr chart, so the Fuel Consumption charts (as well as the Machines table and the Operator Analysis chart) show data for those two trucks only.

To deselect the vehicle/s, select the Clear Master Filter button in the chart where vehicle is selected.
When no machines are selected, the Fuel Consumption charts show the average fuel consumption for the entire fleet.
Using the Fleet Analysis charts
-
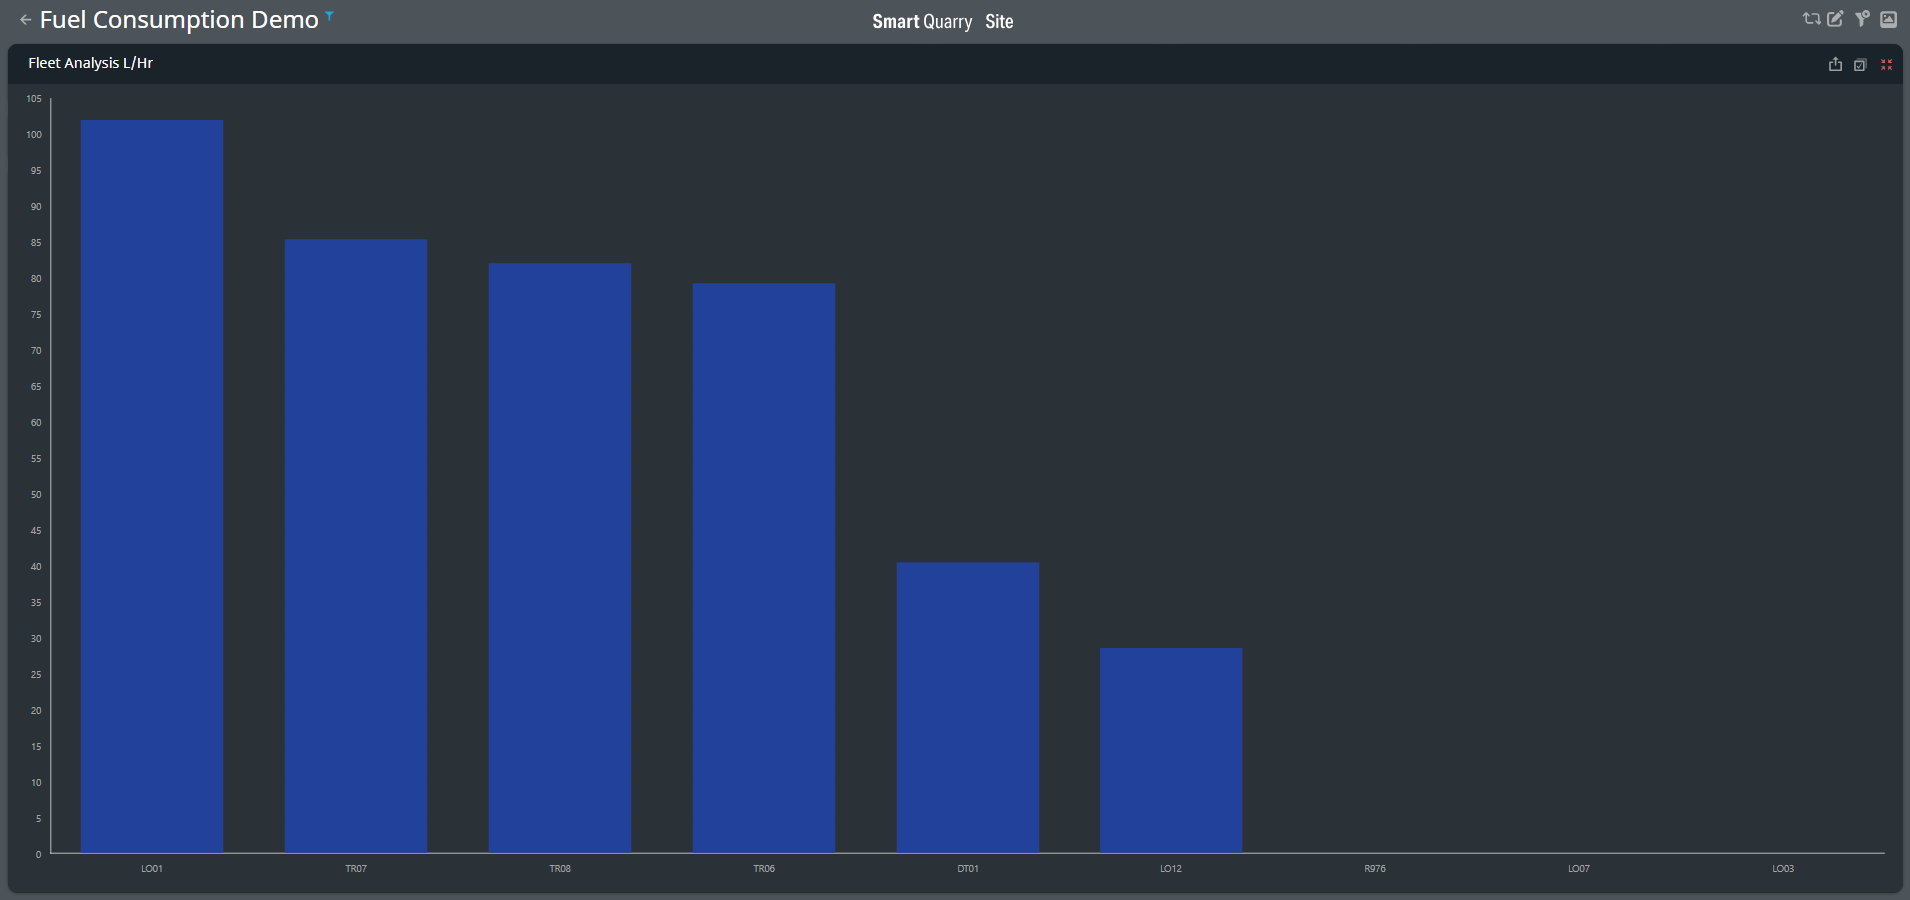
The Fleet Analysis L/Hr chart displays the amount of fuel, in litres per hour, that each vehicle consumed for the given time-period.
-
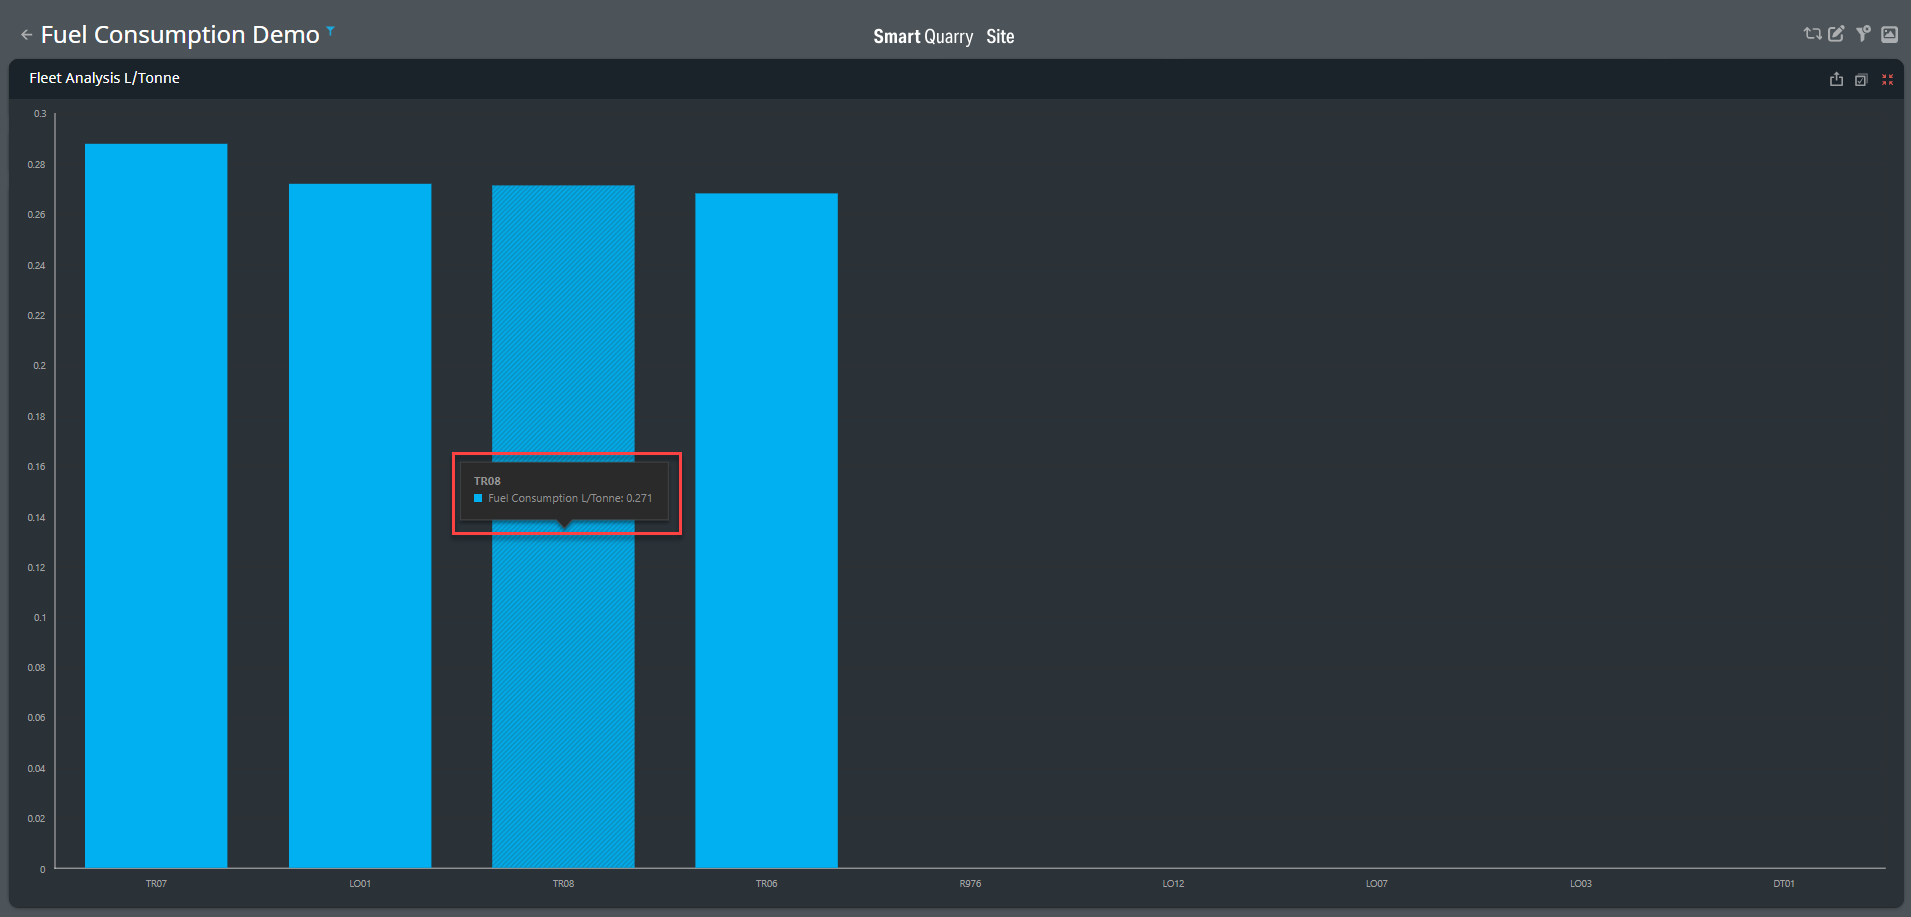
The Fleet Analysis L/Tonne chart displays the amount of fuel, in litres per tonne, that each production vehicle consumed for the given time-period.
-
When you hover over a vehicle's associated bar, the tooltip displays the amount of fuel consumed during the selected time frame.
-
If there are too many vehicles or the chart is too small, not all vehicles appear in the list along the bottom of the chart, however each vehicle is still represented by a bar in the chart.

To see which bar belongs to which vehicle, you can either hover over the bars and read the vehicle names in the tooltips, or you can select the Maximize button to make the chart the full size of the dashboard.
Note: Once Maximized you can minimise back to normal size
Using the Operator Analysis chart
-
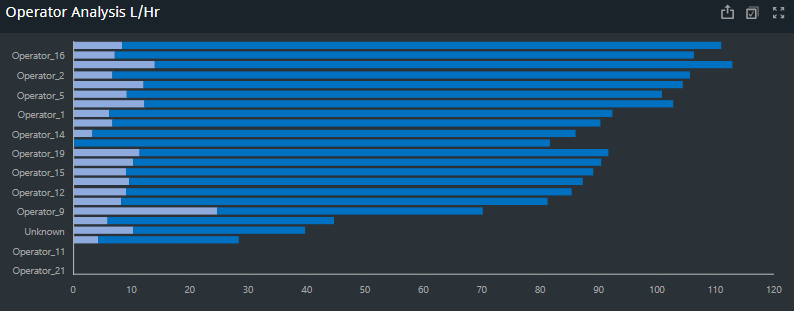
The Operator Analysis chart displays the amount of fuel, in litres per hour, that each operator consumed for the given time-period.
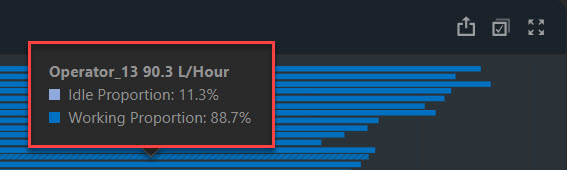
When you hover over the bar next to an operator's name, the tooltip displays the total amount of fuel consumed by that operator, and the proportion of fuel consumed during the working and idling periods.
-
If there are too many operators or the chart is too small, not all operator names appear in the list on the left-hand side of the chart, however each operator is still represented by a bar in the chart.
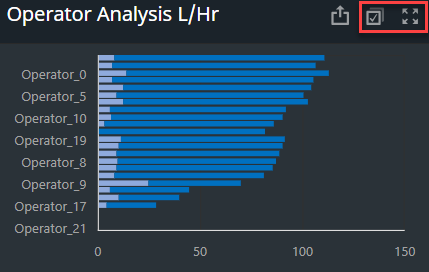
To see which bar belongs to which operator, you can either hover over the bars and read the operator names in the tooltips, or you can select the Maximize button to make the chart the full size of the dashboard.
Note: Once Maximized you can minimise back to normal size
-
You can use the Operator Analysis chart to filter what the dashboard displays. Select the bar next to an operator in the Operator Analysis chart to filter the entire dashboard on that operator and show only their statistics.

To deselect the operator, select the Clear Master Filter button
When Multi-select is active, you can deselect operators by clicking on their bars a second time. To deselect all operators, select the Clear Master Filter button.

To select multiple operators, first select the Multi-Select button, then select the relevant operators' bars. The dashboard updates to display information about the selected operators only.
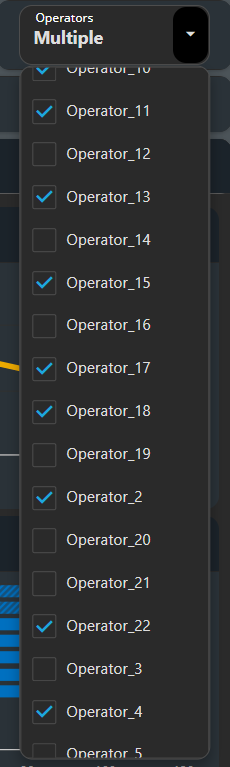
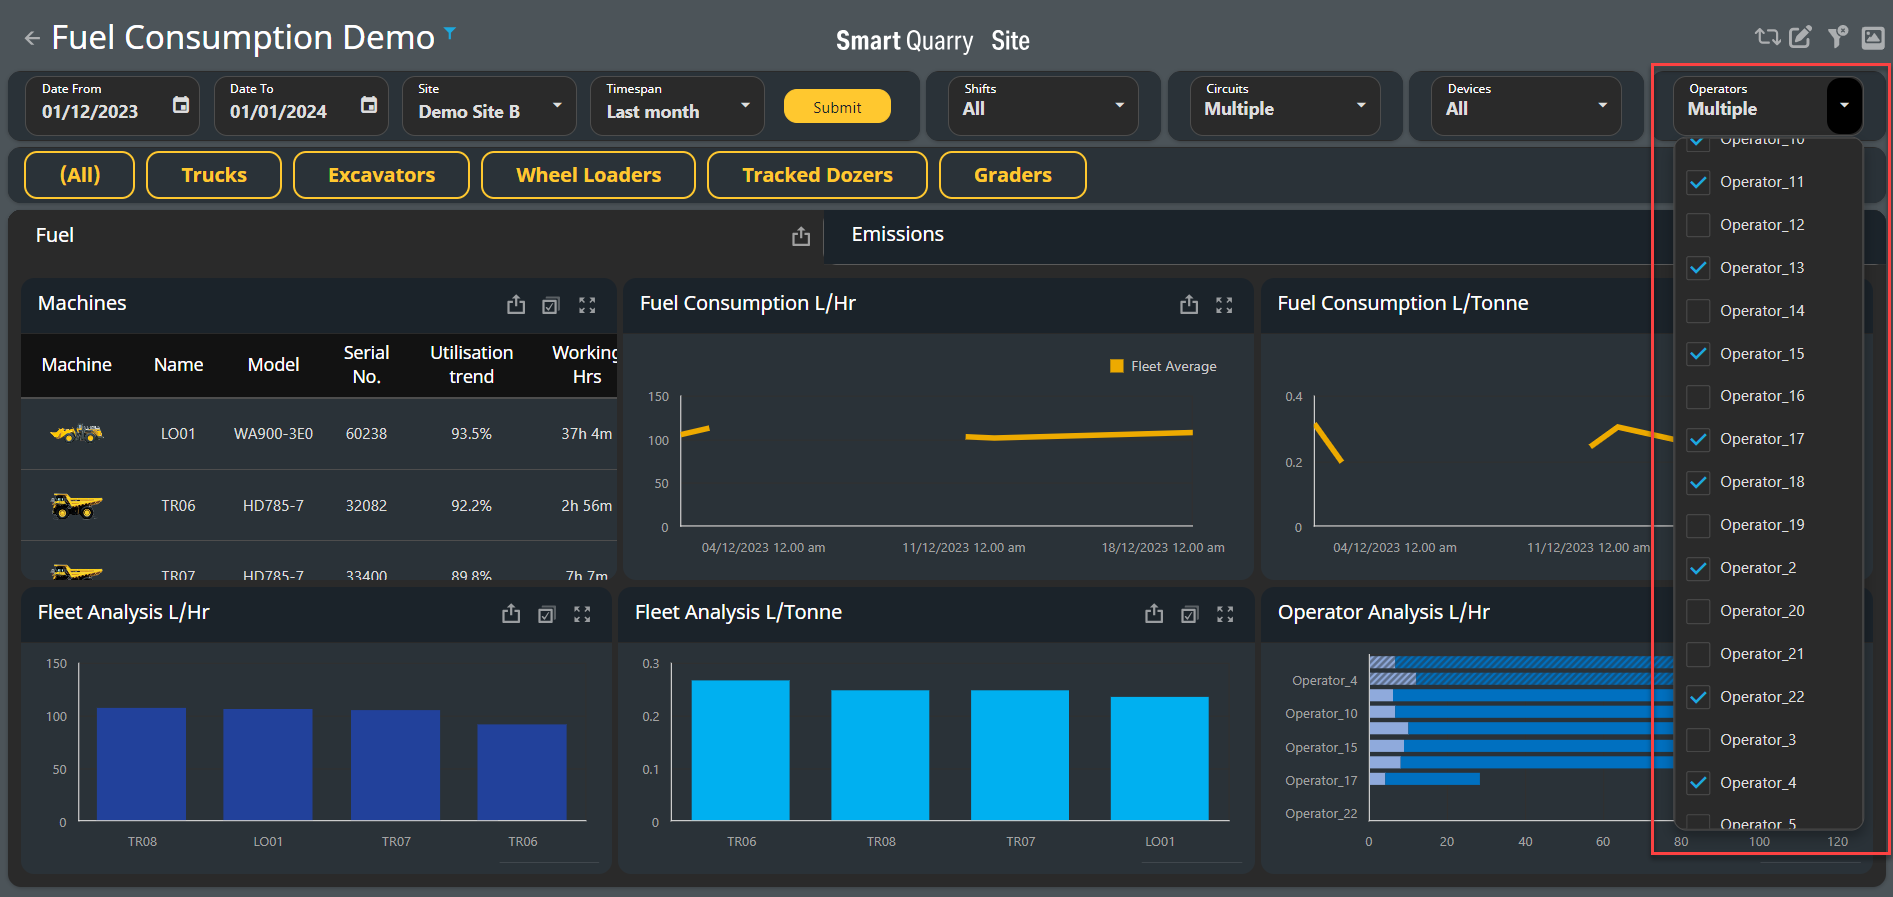
Operators can be selected through the Operator filter in the top right hand side of the Fuel Consumption Dashboard.
You can select individual operators or Multiple operators, once selected the dashboard cards will be updated by Operator selections.