
Machine Manuals
This user guide is not intended to replace the operator or shop manuals for the relevant machines that the Komatsu iSite system is attached to.
It is the operator’s and/or the technician’s responsibilities to read and comprehend the operator and shop manuals and use them as a source of technical and operational information for the relevant machines.
Using the Smart Quarry Site Dashboards
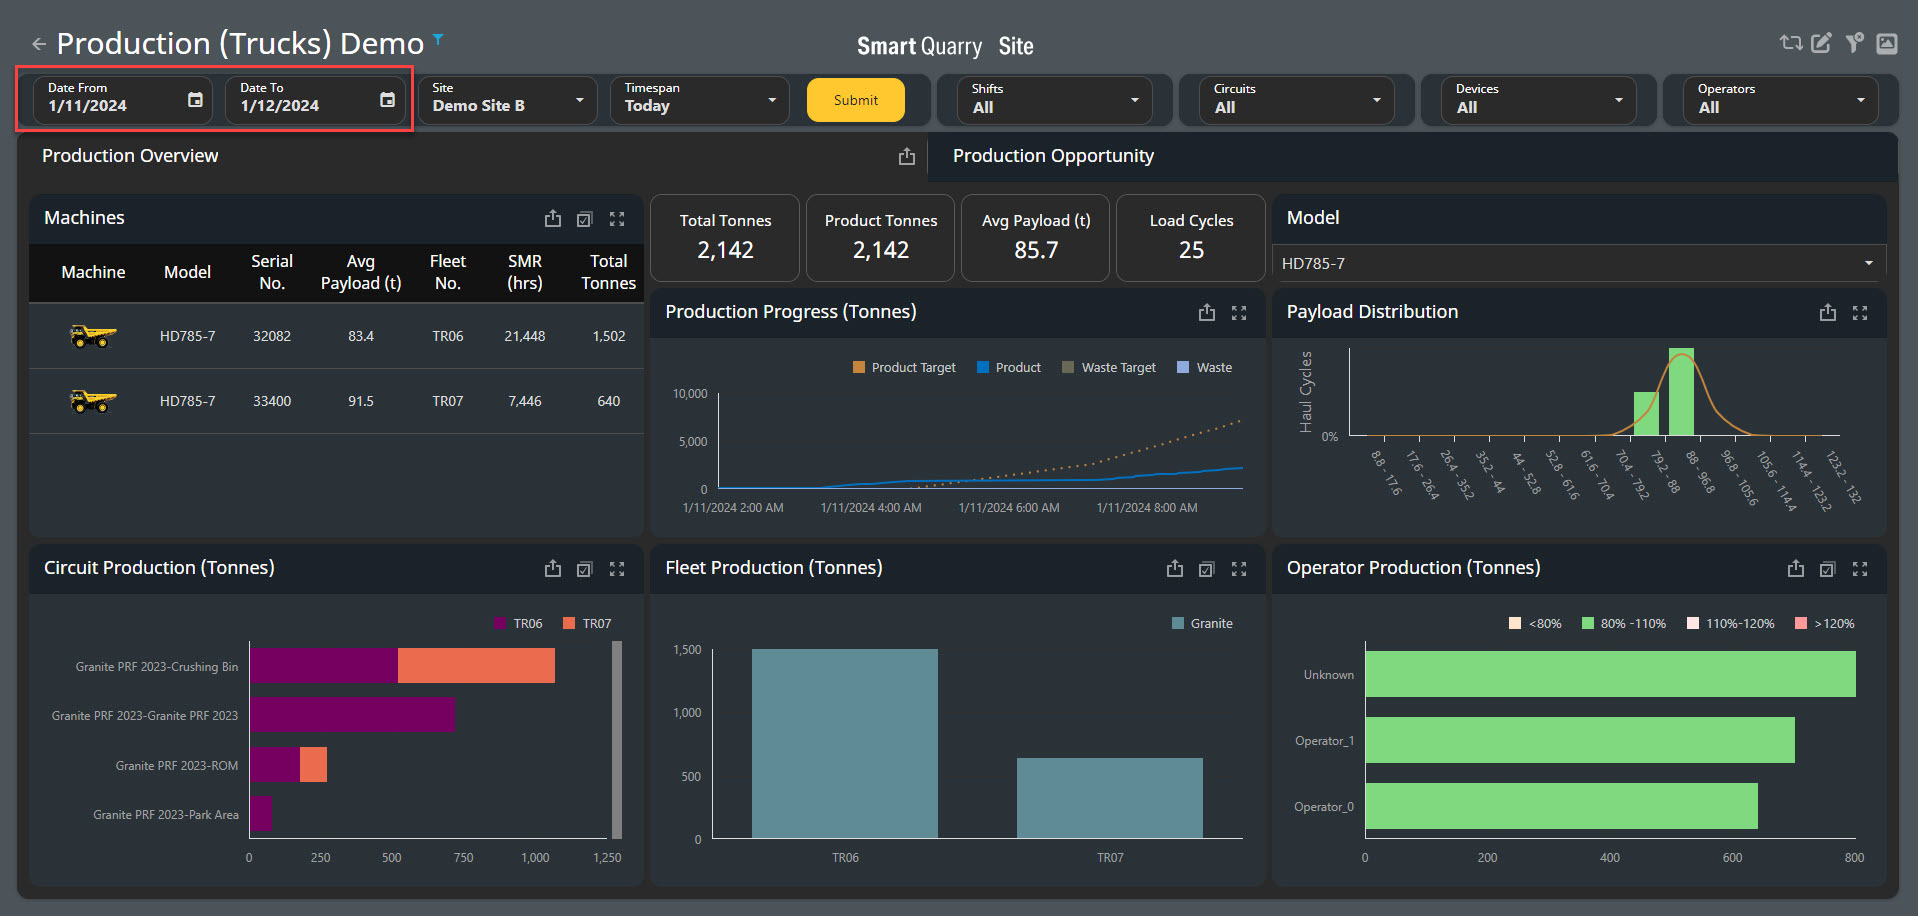
You can use the Smart Quarry Site dashboards to monitor various aspects of your fleet. You can compare models, machine types, materials or even individual trucks or operators.
Use the filters in the top bar to display only data for a given date, time-period, or pre-defined time span. You can use the filters on the right-hand side of the top bars to focus on specific shifts, circuits, devices, operators, or machine types.
Changing the date and Language format for your specific region
The format of the date and language is determined by your browser settings. By default, many browsers are installed with American date and time settings. The following example shows Google Chrome with an American date format.
-
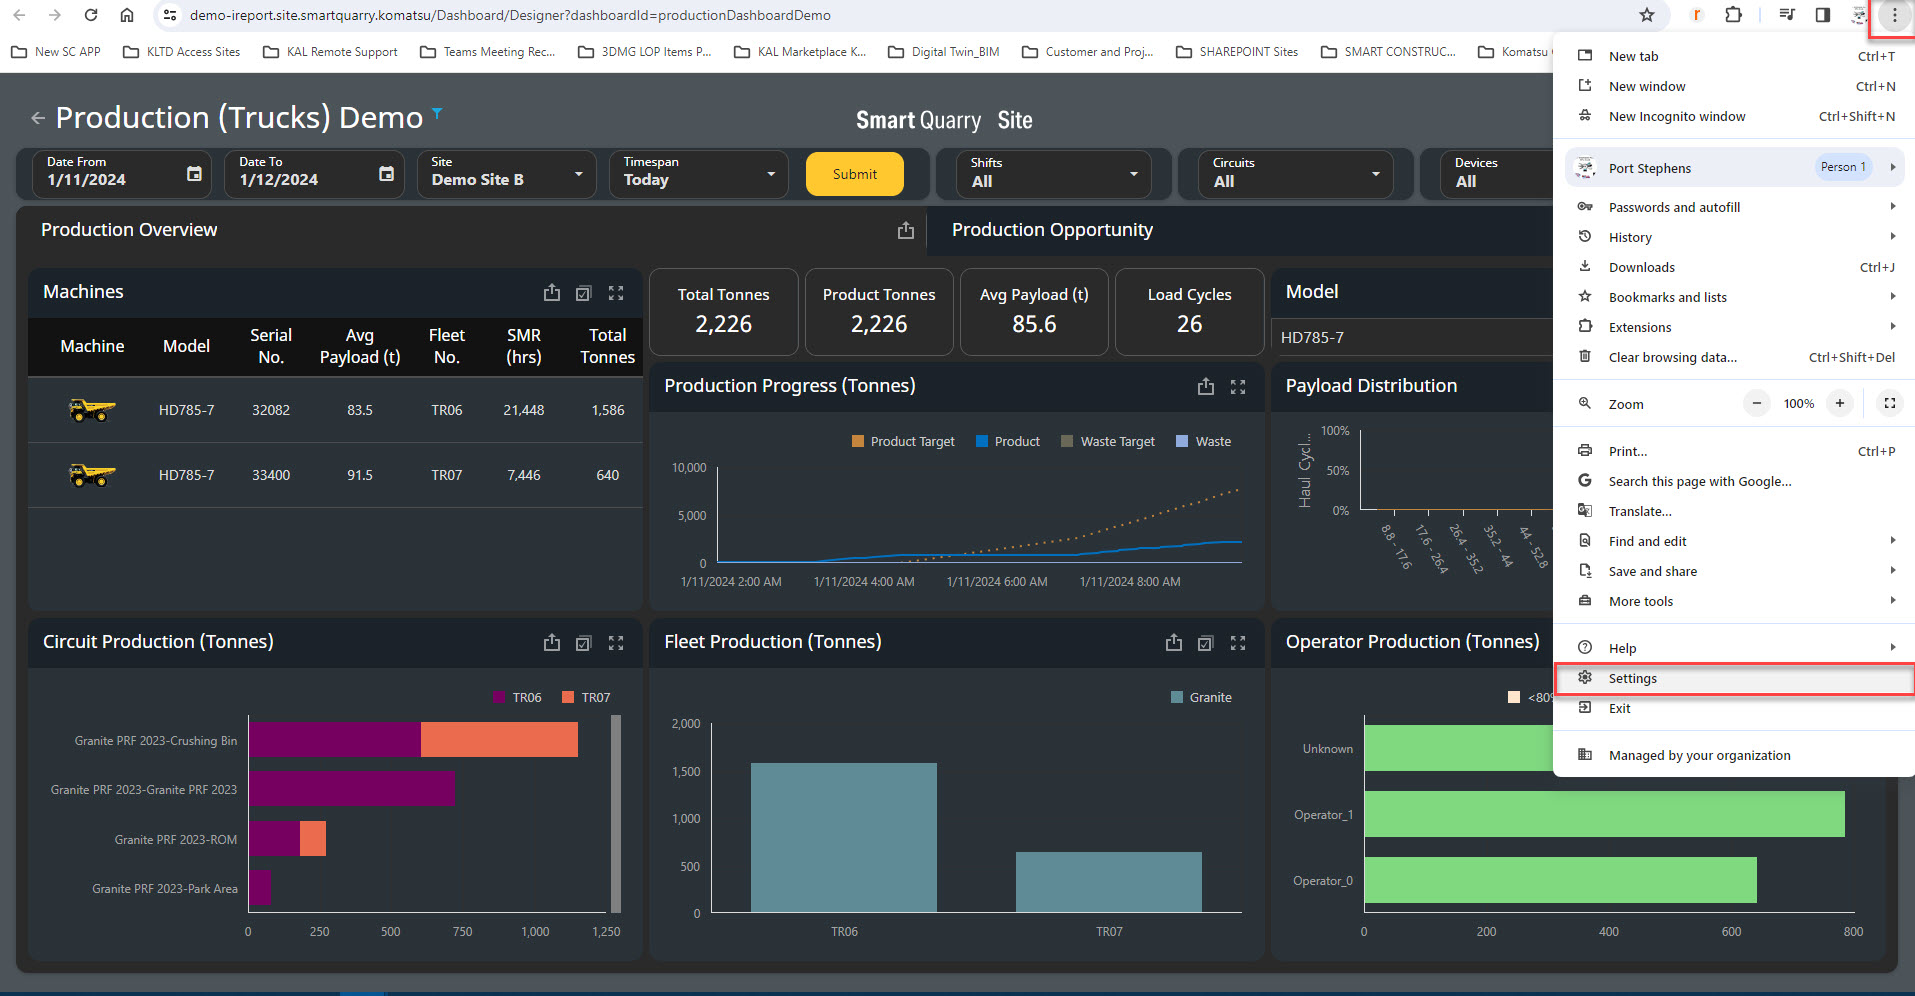
To change the format to Australian in Google Chrome, click the three dots in the upper right-hand corner of the browser window and select Settings.
-
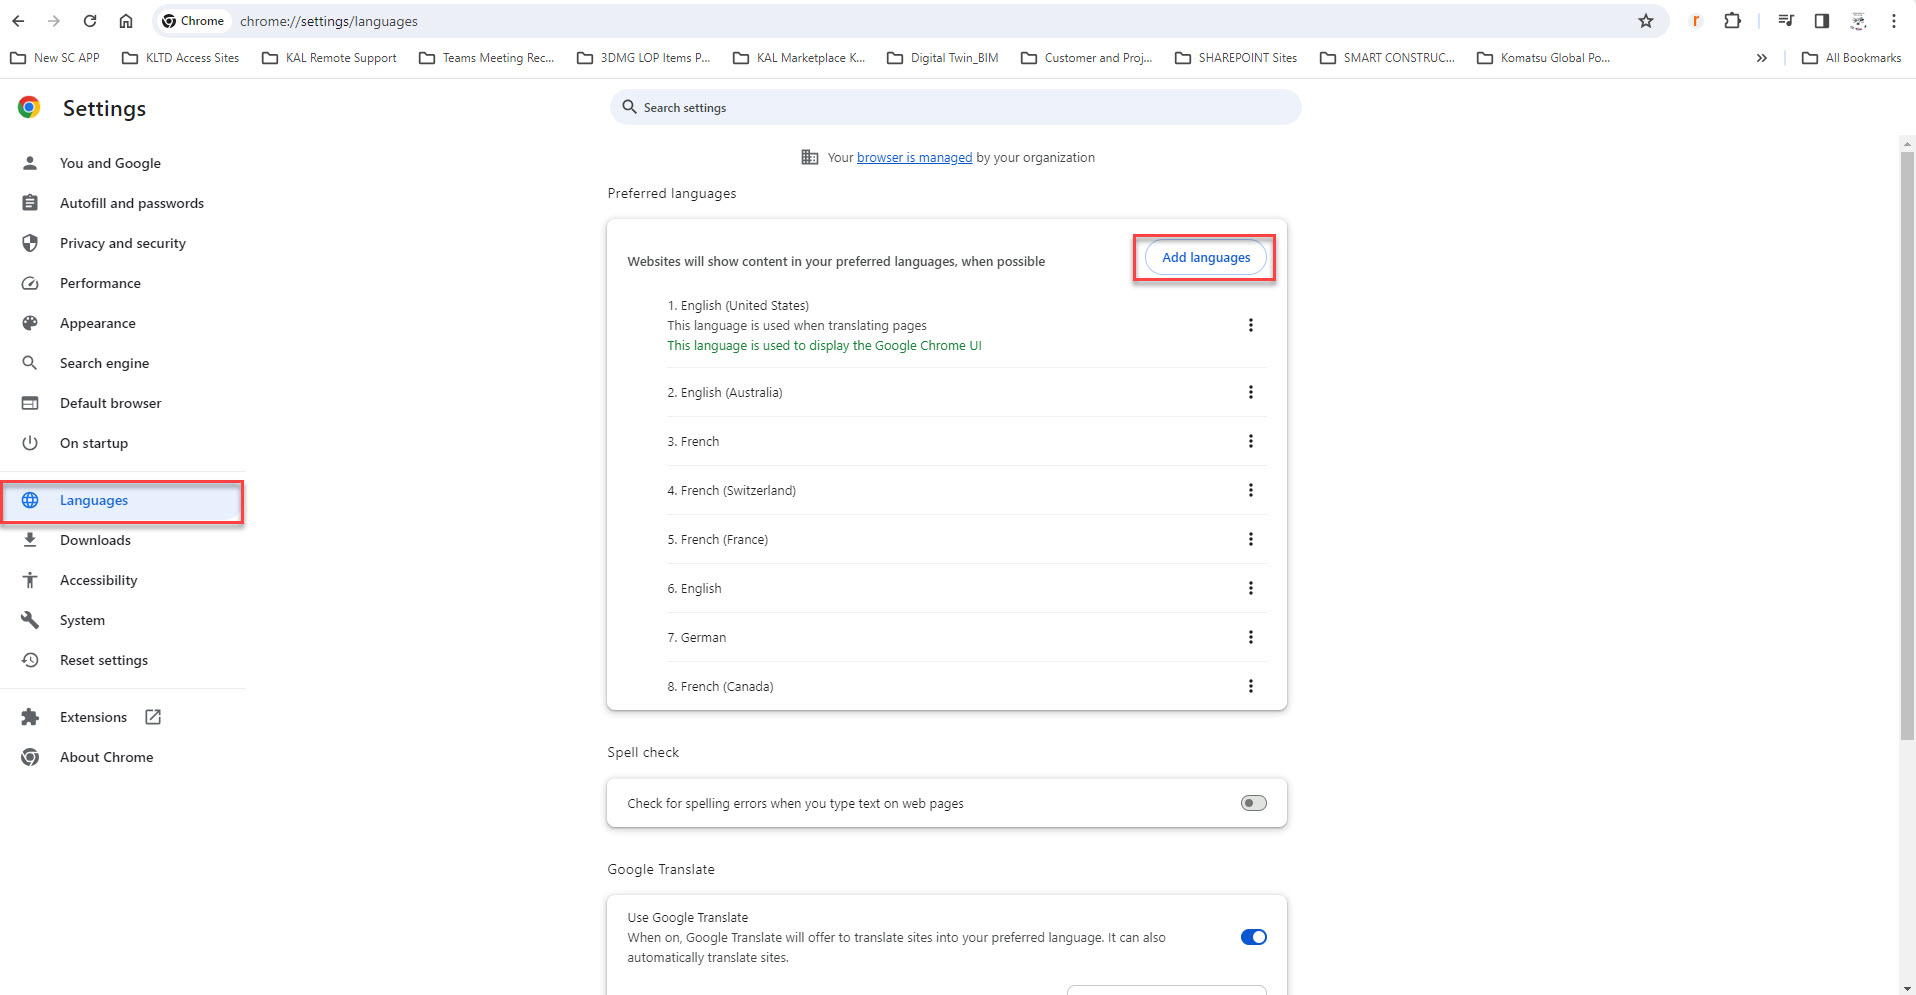
Select Languages from the left-hand menu.
-
Click Add languages. An Add languages window opens.
-
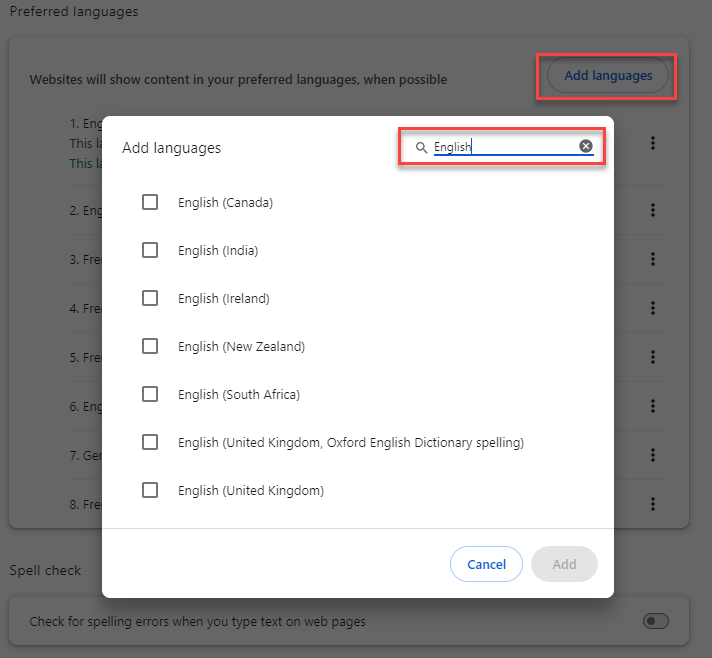
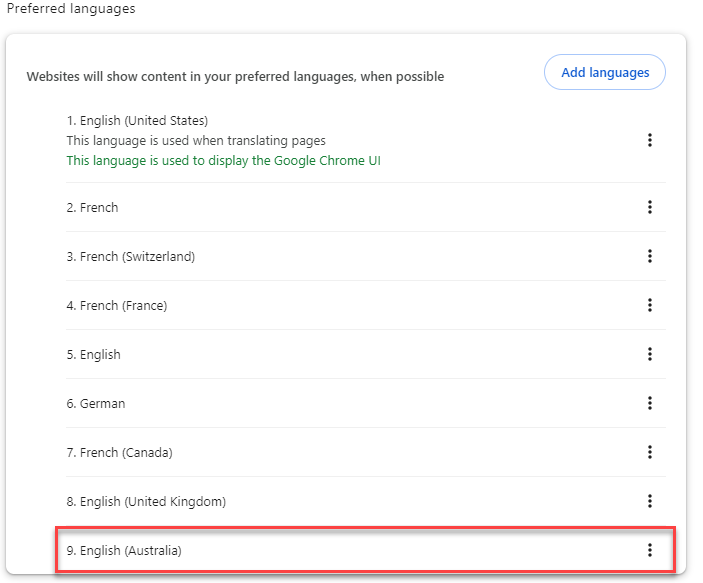
Start typing ‘Australia’ and select English when it appears.
Select compatible Language for your region at this step - Compatible languages:
A) English - region specific
B) German
C) French - region specific
NOTE: More Languages coming soon
-
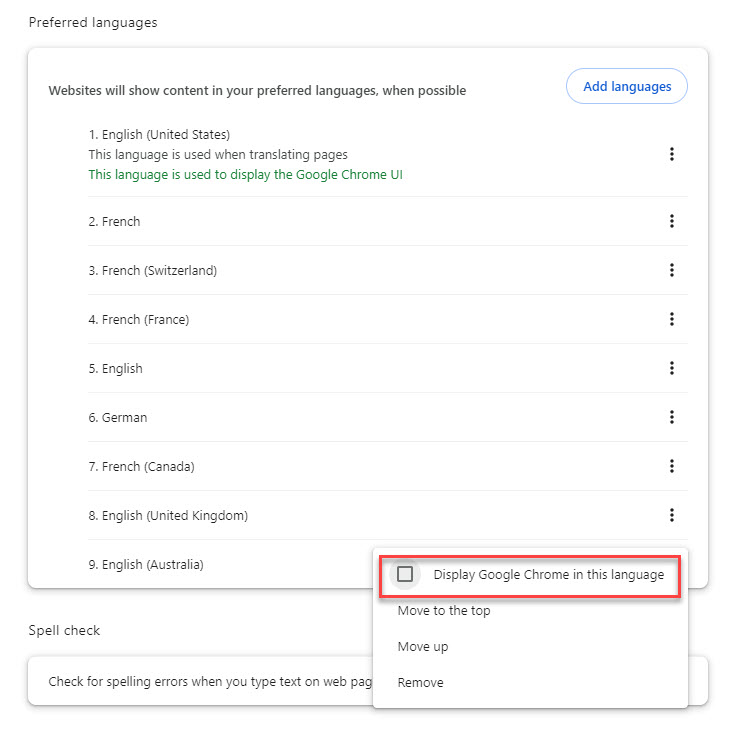
Click Add. English or your selected language, the add language is added to the bottom of the list of languages.
-
Click the three dots in the English (Australia) row and select Display Google Chrome in this language.
-
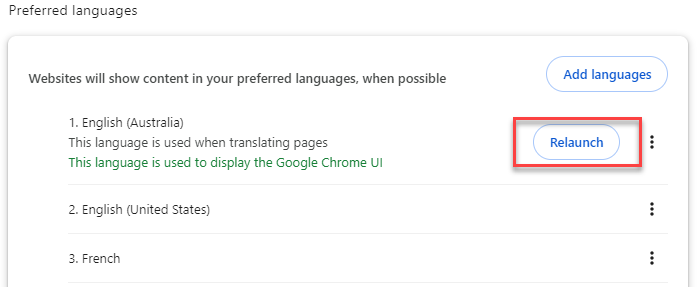
Click Relaunch to restart your browser and apply the new settings. Now the dashboards display all dates in the language format selected for your region.
Choosing a Time Period
-
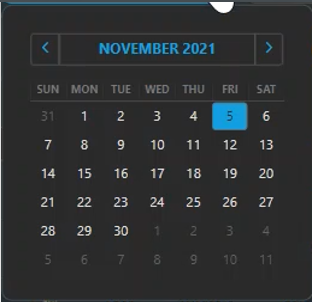
To select a custom time-period, select a data range using the Date from and Date to selectors, then click
For Fleet Focus only the date for one day is available, for all other dashboards please select the custom period
*NOTE: always select the day in advance for the end date custom selection for example: I want to look at yesterday's date, Today's date is the 11 JAN 2024, therefore my customer date selection will be:
Date From: 10 JAN 2024 Date To: 12 JAN 2024
Whether you select a custom time-period or a predefined time span, the dashboard does not include data from the end date displayed. For example, if you select August 2nd to the 9th, the dashboard displays data from the first shift on August 2nd to the last shift on August 8th.
Dashboards are calculated based on Shifts within a 24 hour period, Shifts must cover this 24 hour period
-
To select a custom time-period, select a data range using the Date from and Date to selectors, then click

You can ether type your custom date in for Date From and Date To or select the date field and user the calendar selection feature
-
To select a predefined time span, choose an option from the Timespan drop-down menu, then click
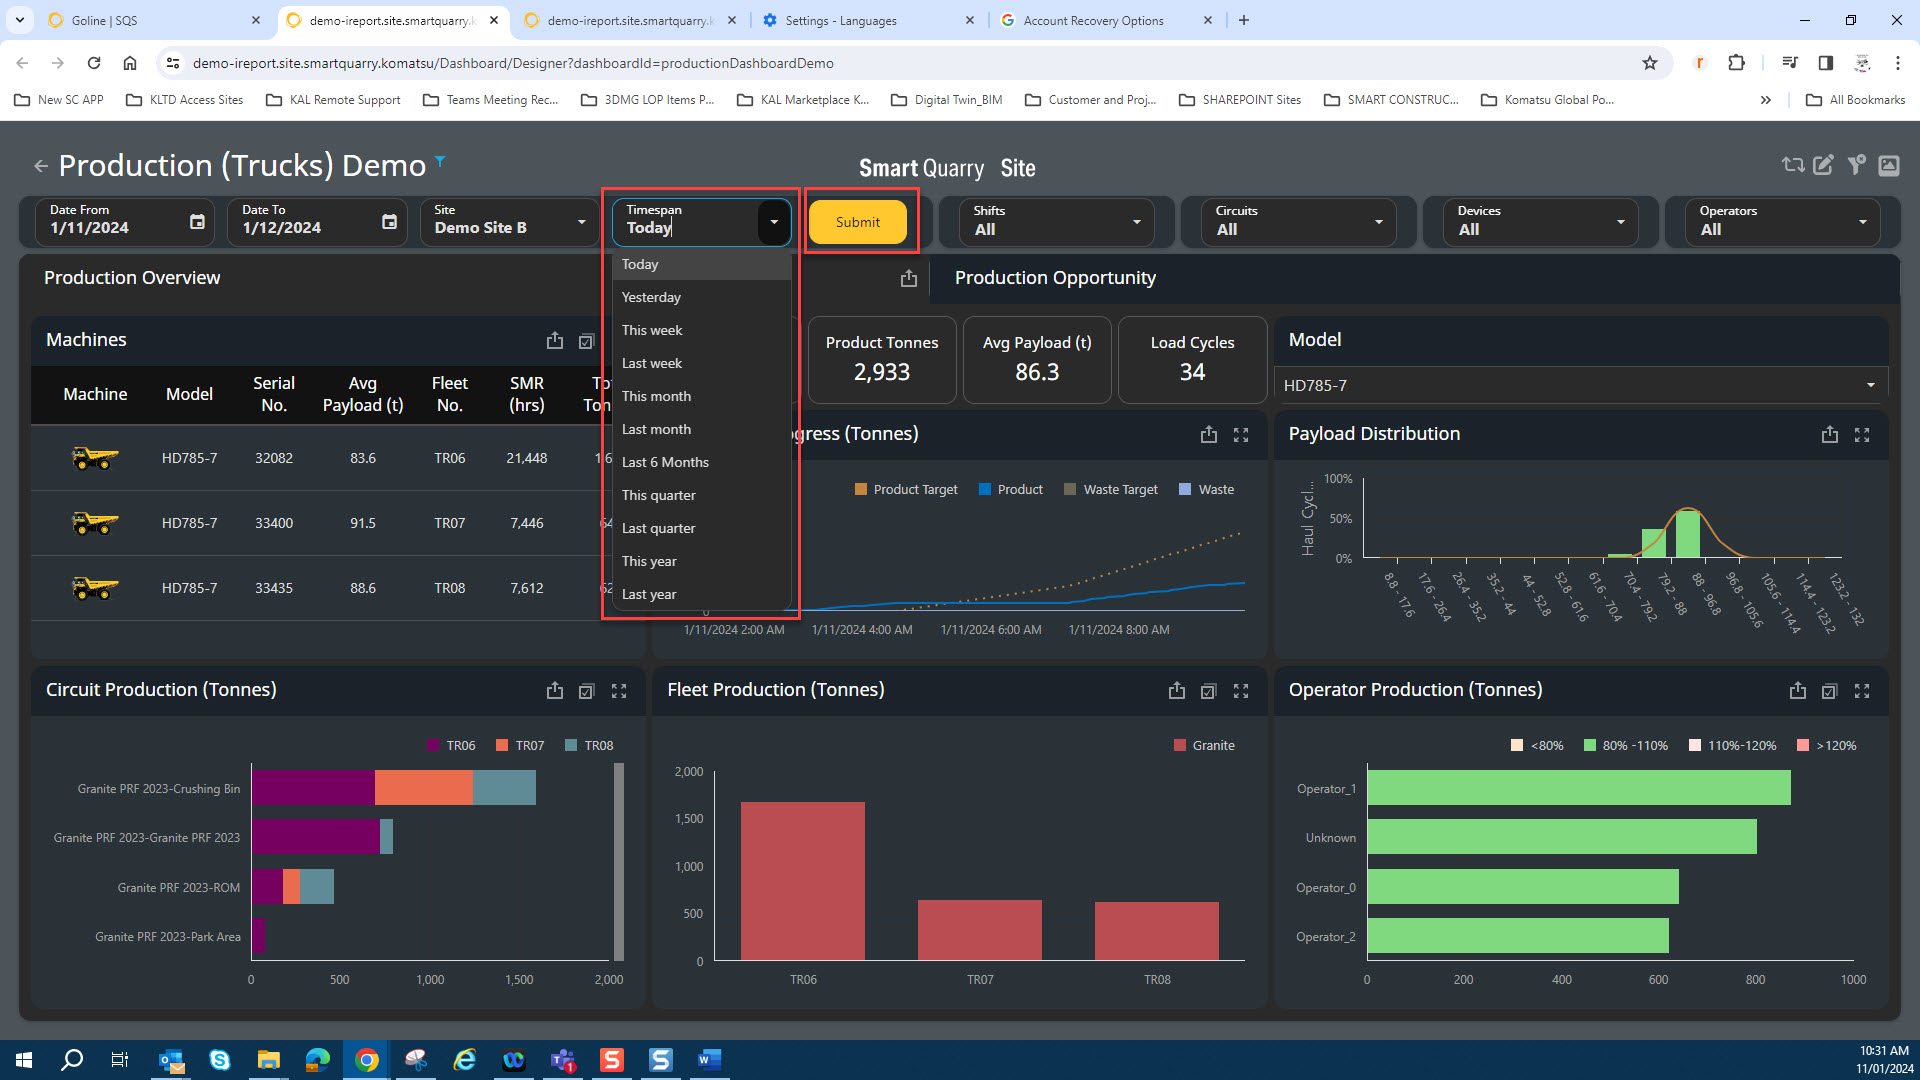
When selecting the date using the TIMESPAN feature - the data shown in the selected dashboard will compare the selected timespan with the previous timespan For Example:
If I select This Week - The dashboard selected will compare Last week with the previous week “where the data is available”
The Dashboard updates only when the user clicks the SUBMIT button
Choosing a Site
-
If you have single site access you will always be directed to the site you have access to.
-
If you are a multiple sites user, the site is selected in Goline - you can defulat and favorite your selection PLEASE GO TO Goline User Guide @ GoLine

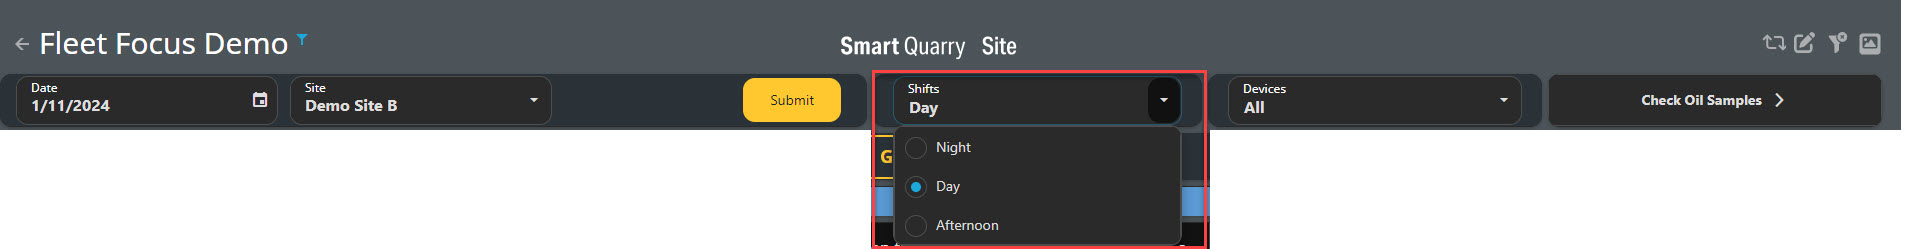
Choosing Shifts to View
-
To select one or more shifts to view, choose one or more options from the Shifts drop-down menu. The dashboard filters the data that was already loaded for the selected timespan and the charts and tables update to show only the data for the selected shifts within the relevant timespan.
Shifts must cover a complete 24 hour period
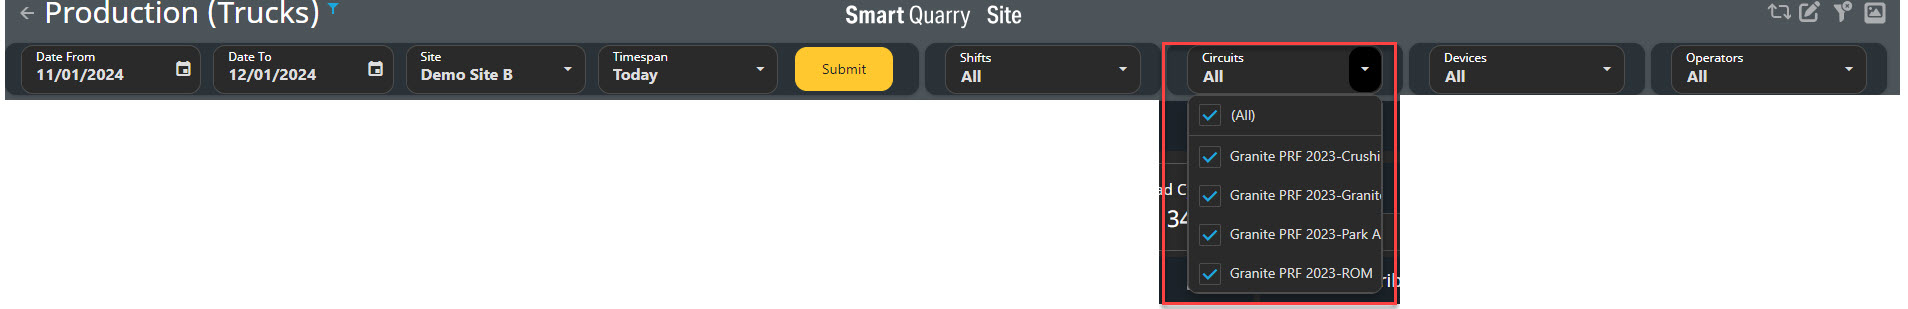
Choosing Circuits to View
-
To select one or more circuits to view, choose one or more options from the Circuits drop-down menu. The dashboard filters the data that was already loaded for the selected timespan and the charts and tables update to show only the data for the selected circuits within the relevant timespan.
Circuits are created in the site master data, these circuits are typically your haul routes on site or specific areas highlighted on the site. These Circuits are attached to geo-fenced positions on the site and can viewed in iControl or Dashboards
For iControl - user guides @ iControl
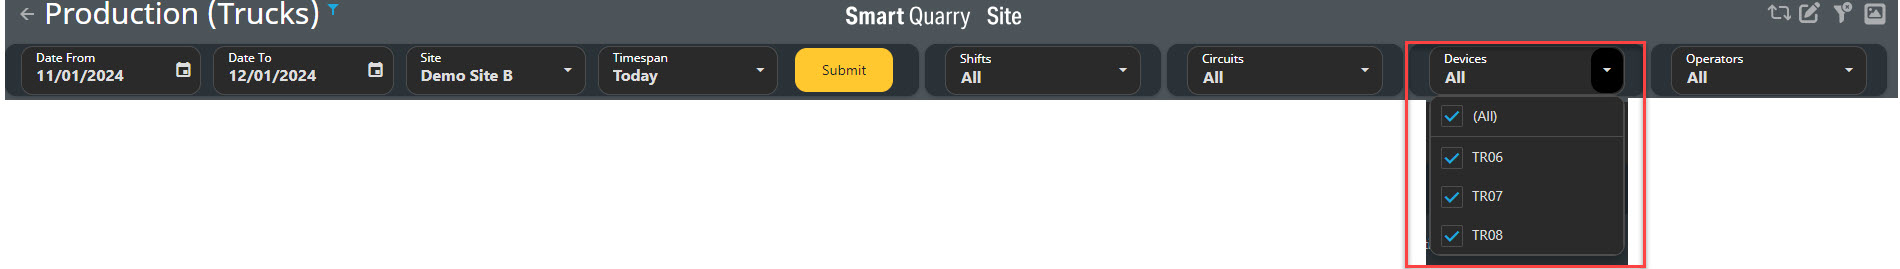
Choosing Devices to View
15.. To select one or more devices to view, choose one or more options from the Devices drop-down menu. The dashboard filters the data that was already loaded for the selected time span and the charts and tables update to show only the data for the selected devices within the relevant time span.
Devices are typically machines fitted with SQS that are connected to your site and setup un the master data
-
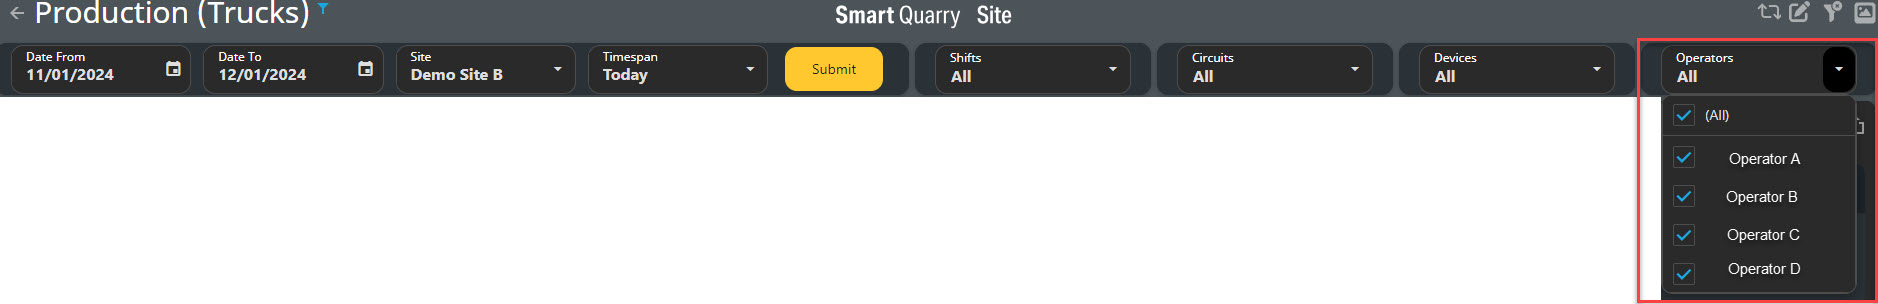
To select one or more operators to view, choose one or more options from the Operators drop-down menu. The dashboard filters the data that was already loaded for the selected time span and the charts and tables update to show only the data for the selected operators within the relevant time span.
Choosing Vehicle Types to View
-
To select a specific vehicle type to view, select one of the vehicle-type buttons. The dashboard filters the data that was already loaded for the selected time span and the charts and tables update to show only the data for the selected vehicle type within the relevant time span.

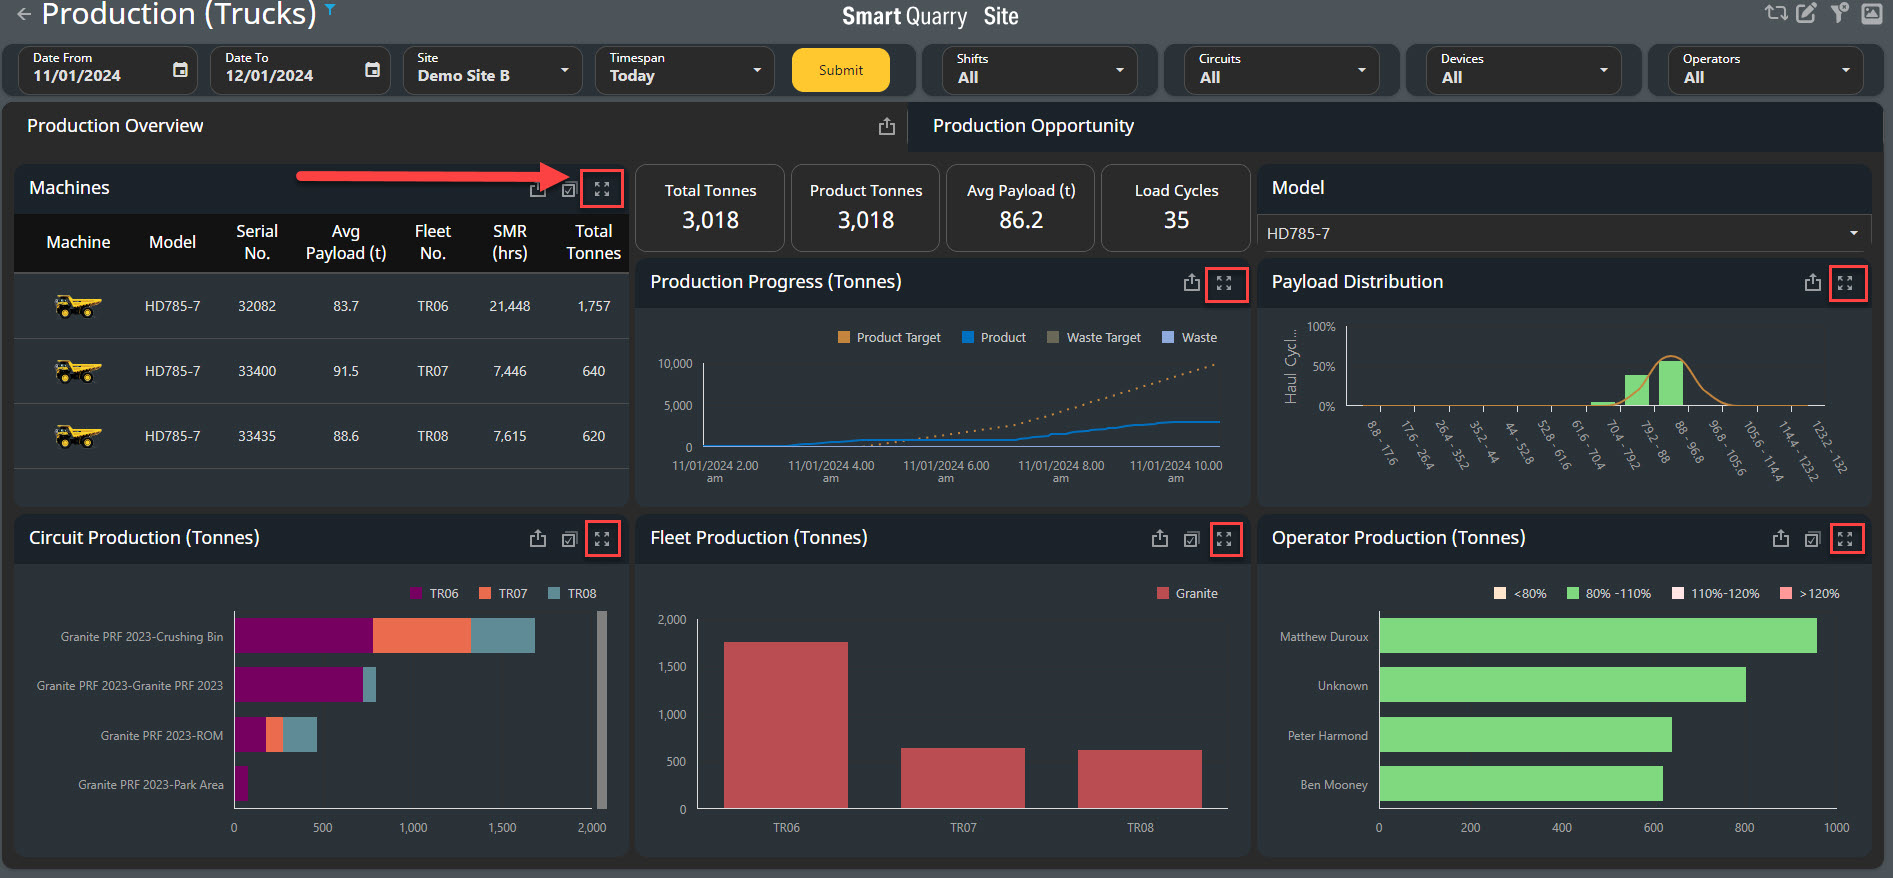
Maximising in on Tables and Charts
-
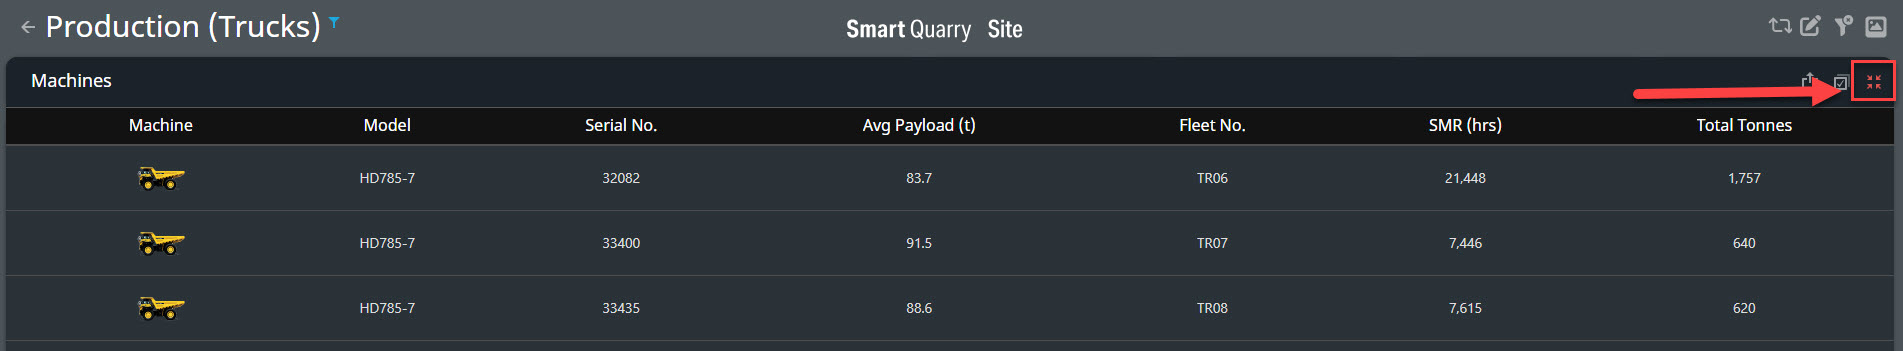
To make a table or chart the full size of the dashboard, select the Maximize button on that table or chart. For example, when you select the Maximize button on the Machines table, it zooms in on that table.

-
To make the chart return to full screen of the dashboard, select the Red Minimise button on that table or chart. For example, when you select the Red Minimise button on the Machines zoomed table, it minimise back to defaulted screen.d

Exporting Dashboard, Charts and Data
-
You can export full dashboard charts and tables to .CSV, PDF and JPEG image files. To export a chart or table, use the Export To button. For example, when you select the Export To button on the Machines table, the Export menu appears.
Export Snapshot - Dashboard Exporting

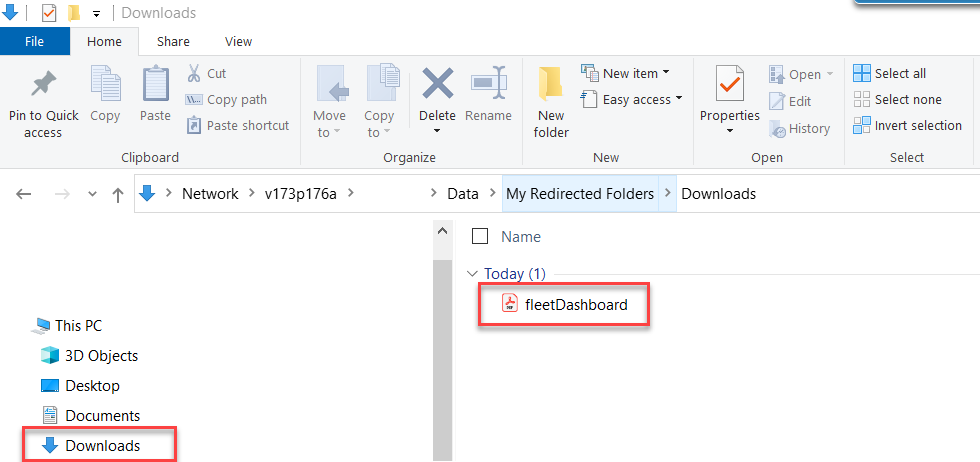
The selected Snap Shot Export will be send to your browser Downloads in a .PDF format
Export To Feature - Dashboard Exporting
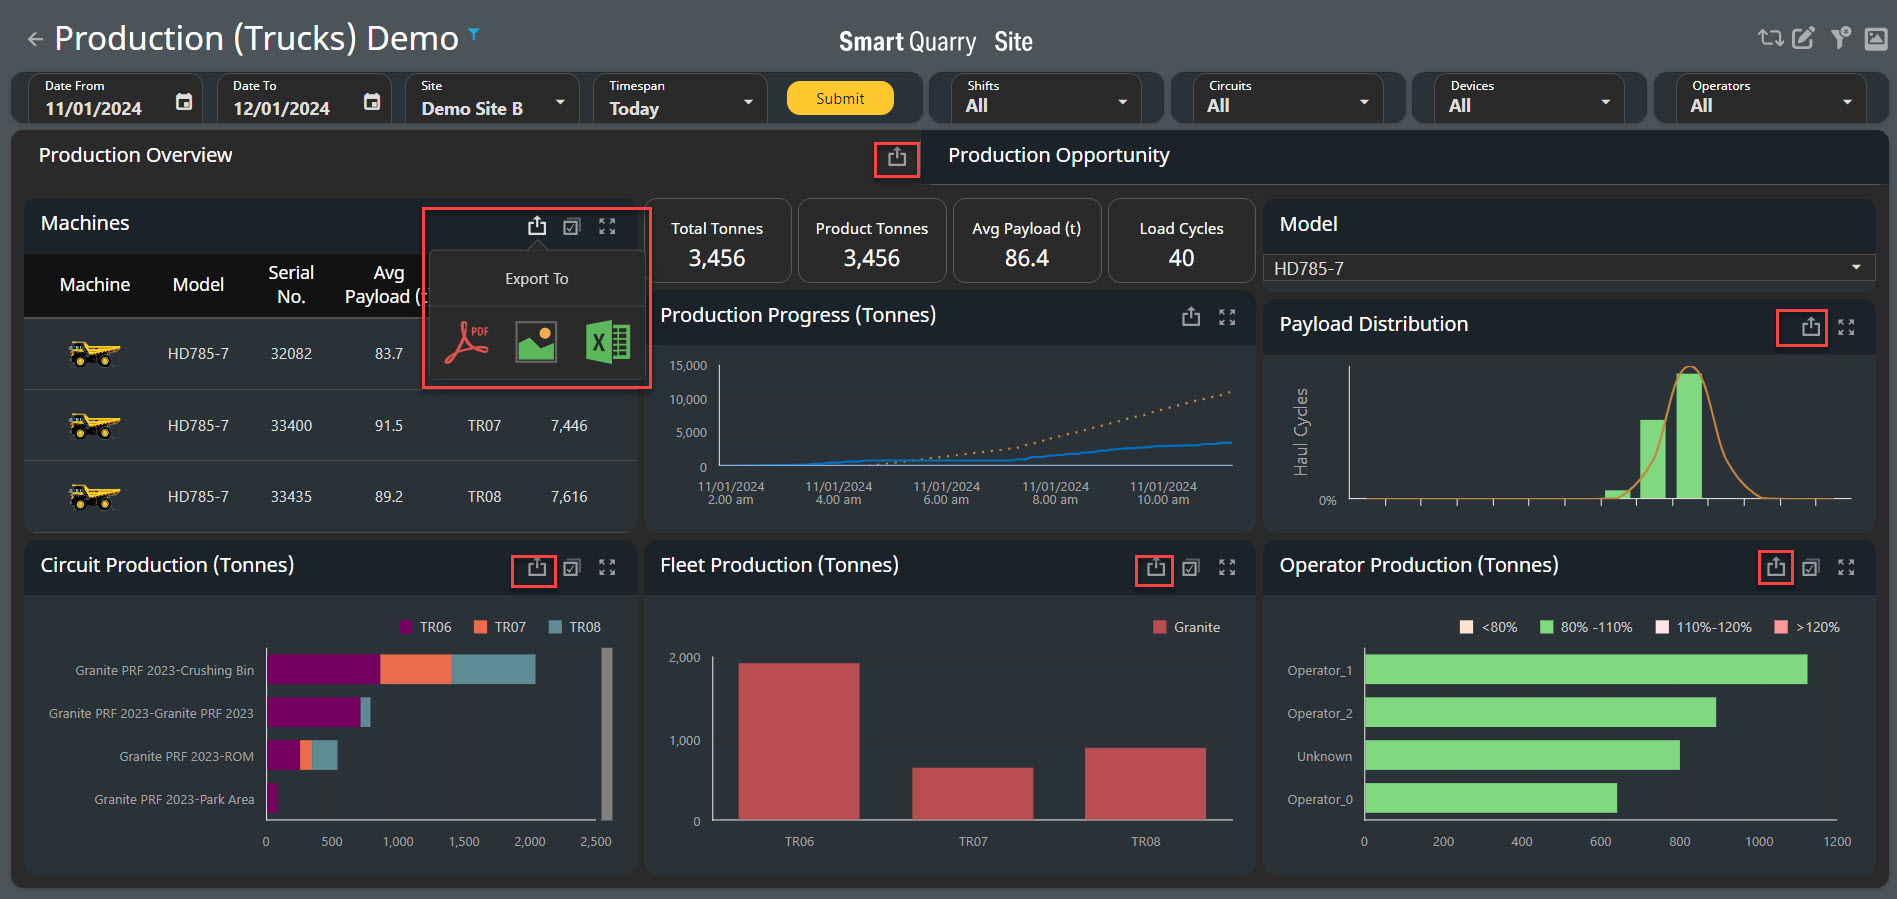
The selected Snap Shot Export will be send to your browser Downloads in a .PDF format
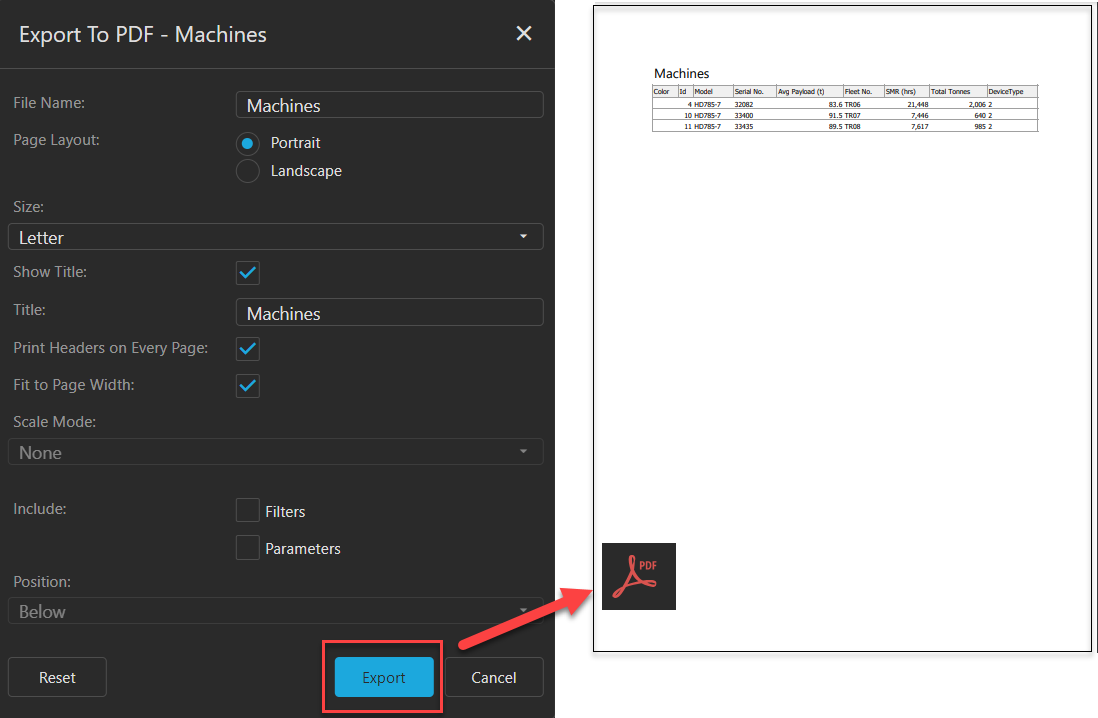
Exporting Charts and Tables to PDF Files
-
To export a chart or table to a PDF file, complete the following steps.
-
Select the Export To button of the chart or table you wish to view.
-
Select the PDF icon.
-
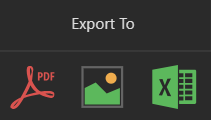
c. Customise the options as required, then press Export to generate a PDF report
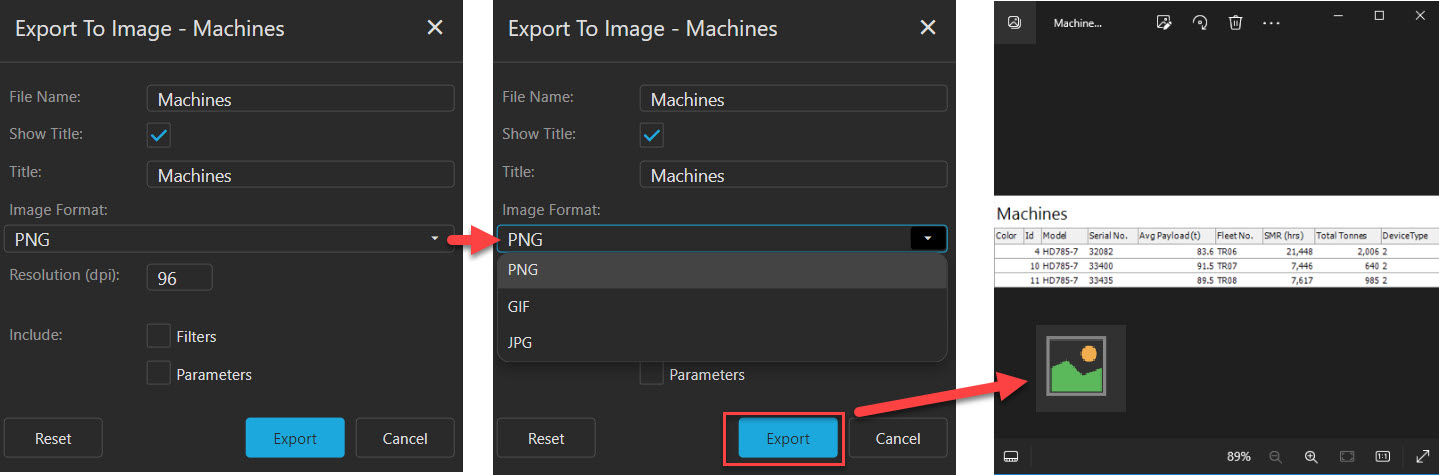
Exporting Charts and Tables to Image Files
The selected Export will be send to your browser Downloads in a .PNG, .GIF or .JPG format
-
To export a chart or table to an image file, complete the following steps.
-
Select the Export To button of the chart or table you wish to view.
-
Select the image icon.
-
c. Customise the options as required, then press Export to generate an Image report.
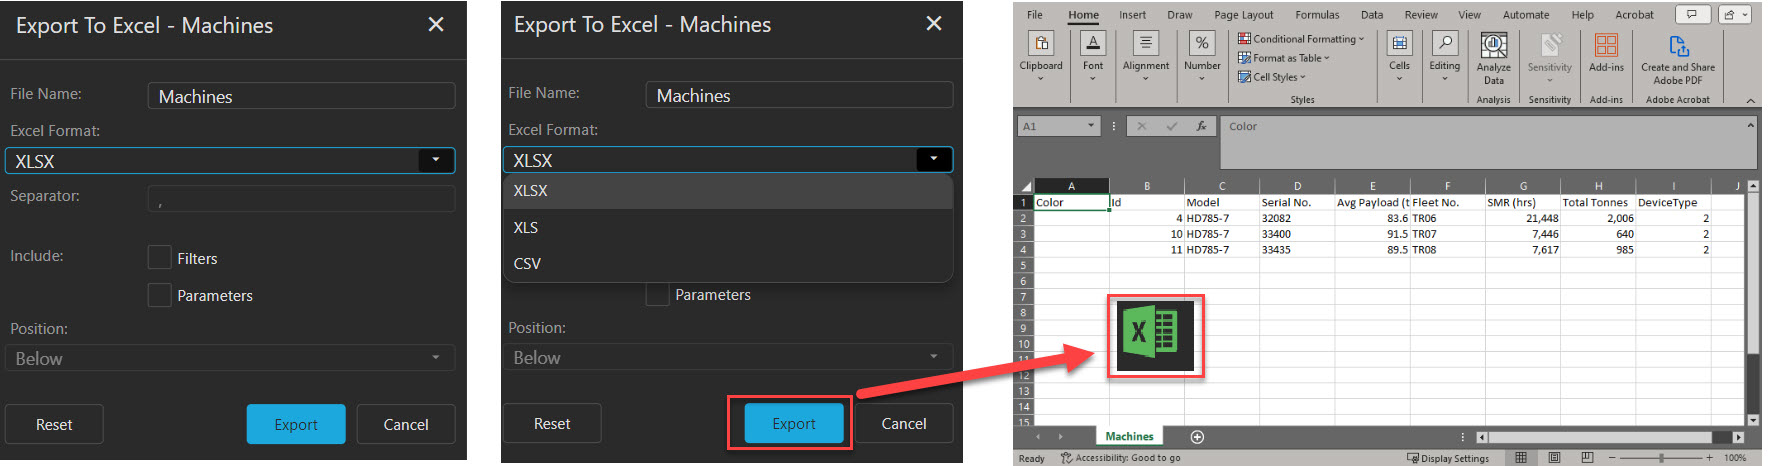
Exporting Data to Excel
The selected Export will be send to your browser Downloads in a .XLSX, .XLS, .CSV format
-
To export chart or table data to an Excel spreadsheet, complete the following steps.
-
Select the Export To button.
-
Select the Excel icon.
-
c. Customise the options as required, then press Export to generate an Excel report.
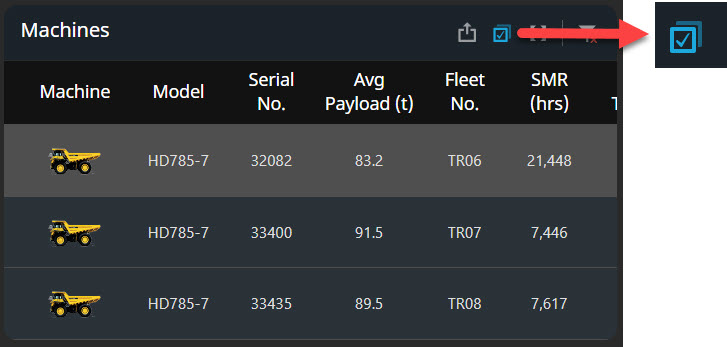
Multi-Select Feature
-
To multi select any selections within the dashboards, you need to select the Multi Select button in the upper right-hand corner of the dashboard.
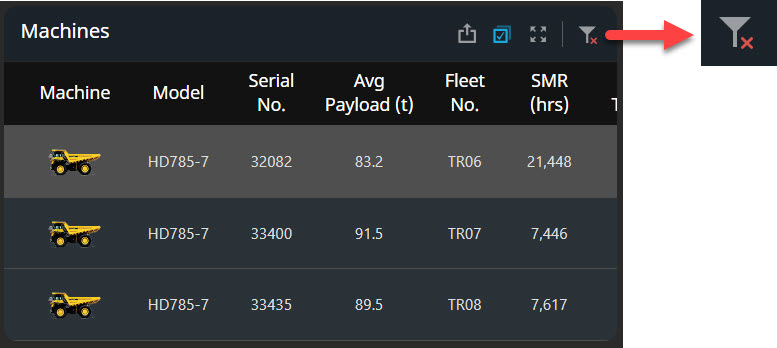
Clearing your Selections
-
To clear all your selections and filters from the dashboard, select the Reset filters button in the upper right-hand corner of the dashboard.
-
To clear your selections in a specific table or chart, select the Clear Master Filters button in that relevant table or chart
Any selections in the top bar, such as a time span or specific shift, remain active when you use the Clear Master Filter button to clear the selections on a specific table or chart.