
Fleet Focus Table Of Contents
Fleet Focus Dashboard Column Descriptions
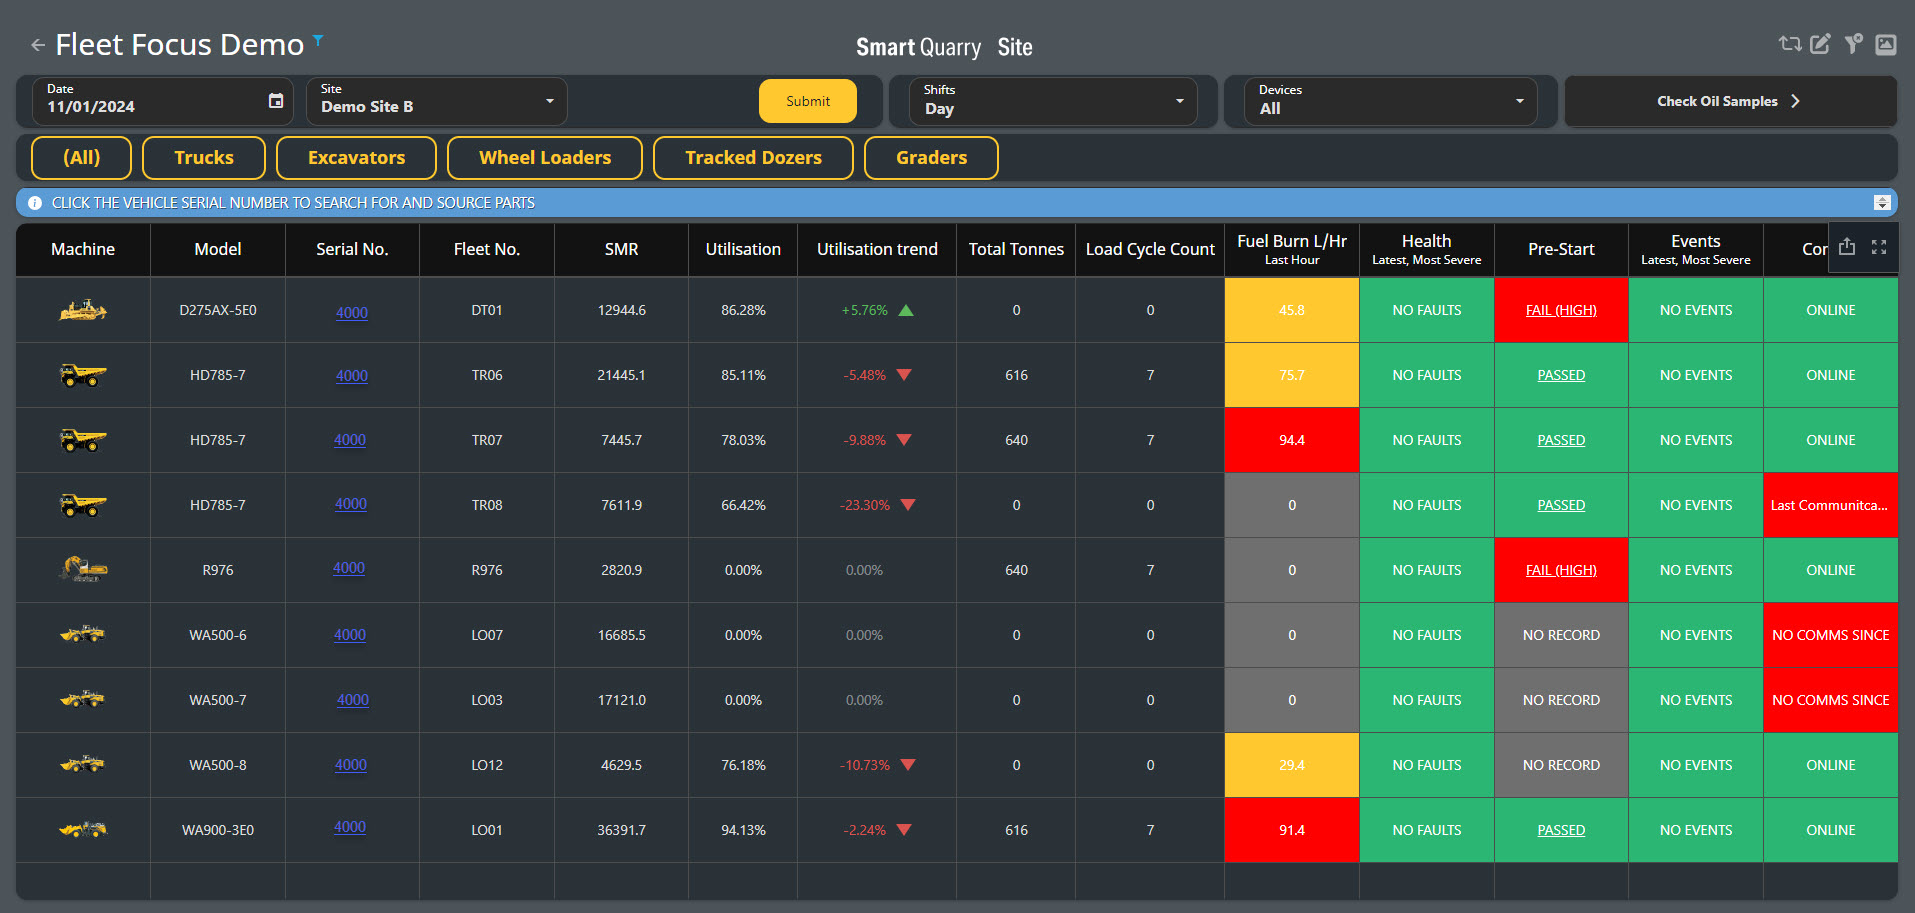
Machine
An Image that corresponds to the machine type.
Model
The Model Number of the Vehicle
Serial No.
If the device is a Komatsu vehicle, the serial number links to the parts page for that vehicle in the myKomatsu store so you can easily order new parts.
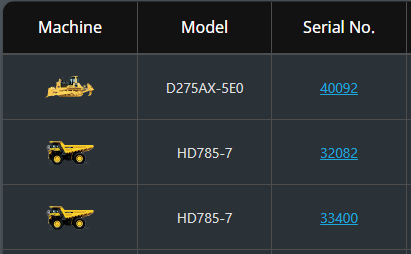
Fleet No.
The Vehicle Call Sign in iControl
SMR (h)
Service Meter Reading (SMR) of the vehicle, in hours.
Utilisation
Working utilisation rate, the time a vehicle spent working compared to its total active time (working or idle), which is calculated as follows:
(total working hours) / (total working hours + total idle hours)
Utilisation Trending can be set up in the site setup master data and is Defualt to 1min for idle machines, therefore any machines that idle for less then 1 minute, hours and % will be added to utilisation
-
Any machine idling longer then 1 minute will be calculated as idle %
NOTE: Contact Smart Construction Support to find out how.
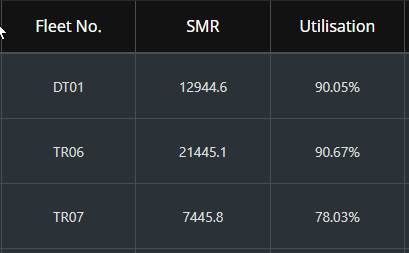
Utilisation Trend
Percentage increase in utilisation compared to the previous day. If the utilisation trend improves from the previous day, it displays in green. If the trend worsens as compared to the previous day, it displays in red. If the trend doesn't change, it displays in grey.
The trend considers the selected shift in its calculation, so if you've selected night shift, the trend compares the previous day's night shift.
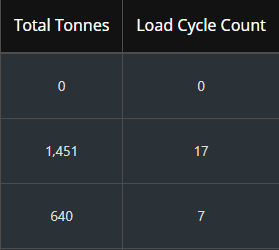
Total Tonnes
The total tonnes of production and waste material this vehicle moved in all load cycles for the selected date and shift.
Load Cycle Count
The total number of load-cycles the vehicle completed for the selected date and shift.
Load cycles are assigned to a shift based on the date and time of the last load pass. For example, if a truck begins loading at the end of one shift but the last load pass is in the next shift, the load cycle is assigned to that next shift.
These two values (Total Tonnes and Load Cycle Count) apply only to vehicles that have load cycles: Trucks and Loaders.
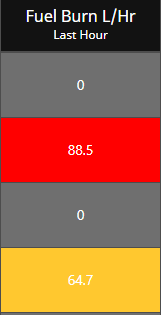
Fuel Burn L/Hr
The fuel burn per hour for the vehicle, as calculated from the last hour of data in the shift.
For example, if the selected shift ends at 2 PM, the fuel burn calculation is based off the data from 1 PM to 2 PM.
If the selected shift is currently in progress (that is, not yet complete), the fuel burn calculation uses the data from the hour prior to the current time. So, if it's currently 1:30 PM, the fuel burn calculation is based off the data from 12 PM to 1 PM.
Fuel burn is calculated as follows:
(total fuel consumed / total utilisation time)
The Colour for the Fuel Burn column is calculated as follows:

The fuel burn value is higher than the manufacturer's maximum rating for this vehicle model.
The fuel burn value is lower than the manufacturer's maximum rating for this vehicle model, but higher than the top of the ideal range.
The fuel burn value is within the manufacturer's ideal range for this vehicle
The fuel burn value is below the manufacturer's ideal range for this vehicle.
No recorded fuel burn, or 0.
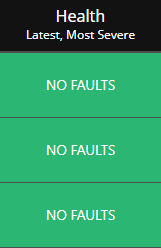
Health
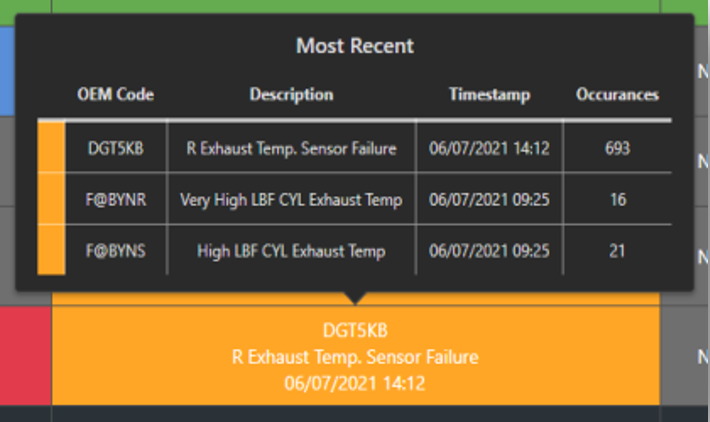
Health events for the vehicle from the selected time span. Health events are defined as any event raised by the vehicle from a third-party vendor, not generated by the Komatsu iSite system. A health event contains four components:
OEM code: The OEM code of the event.
Description: Description of the event. For example, Sensor failure or Engine power intermittent.
Timestamp: The time when the event was generated by the vehicle.
Severity: The severity score of the event. Events are assigned a numerical score to represent the severity of the event. This is based on individual OEM Protocols. This score is then used to assign a colour to the event as follows:
The Colour for the Machine Health Events column is calculated as follows:

Greater than or equal to 255
Greater than or equal to 192 and Less than or equal to 254
Greater than or equal to 128 and Less than or equal to 191
Greater than or equal to 64 and Less than or equal to 127
The Health cell for each vehicle displays [3] of the most recent health event with the highest severity in any selected shift.
If one or more health events occur in the selected time span, you can hover over the cell in the table for more information in a tooltip, which displays the most recent health events for that vehicle. The tooltip displays the OEM error code, description, timestamp, and the number of times the event occurred in the selected time span.
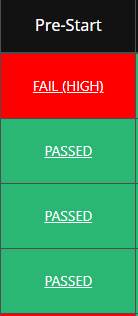
Pre-Start
Pre-start check result for the vehicle for the selected shift, if applicable. The pre-start cell contains the text result of the pre-start check (Passed, Fail, Incomplete, or No Record) and is colour coded according to the result, as follows:
The Colour for the PreStart column is calculated as follows:

Fail (Low)
Fail (Medium)
Fail (High)
Incomplete
Passed
No Record
All results (except for No Record) link to the most recent detailed pre-start report that is generated by iReport for the selected date and shift.
No Record indicates vehicles that have not yet started a pre-start report. Incomplete indicates that a pre-start report has been started but is not yet finished.
Failed or Incomplete Prestarts are allocated to Operator ID and on submitted Prestart will generate a EMAIL “Notification” to the supervisor or maintenance manager
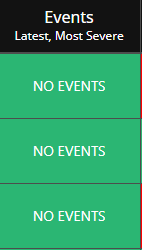
Events
If the Komatsu SQS system on the vehicle generates an event during the selected time span, the Events cell is red and displays the event description and timestamp.
If the Komatsu SQS system generates multiple events, the Events cell is red and displays the most recent event with the highest severity.
Note: Speed Limit Exceeded is also displayed in this location - identifying speed infringements during the shift selected.
Events displayed in this column are limited to the following Komatsu SQS events:
· Speed Limit Exceeded
· Komtrax Comms Lost
· Komatsu PLM Comms Lost
· CDL Comms Lost
· GNSS 2D Fix Lost
· GNSS 3D Fix Lost
· GNSS Antenna Open Circuit
· GNSS Antenna Short Circuit
· GNSS Antenna No Power
· BAM Comms Lost
· Generic J1939 Comms Lost
· Ignition Digital Input Fault
If the Komatsu SQS system didn't generate any events during the selected time span, the Events cell is green and displays No Events.
Based on the type of data available these events and event densities can change - can be effected by direct / API / Age of machine or Telematics access available.
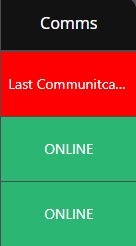
Comms
Information about the last time the vehicle contacted the Komatsu iSite servers.
The content displayed in the Comms column depends on the time of the last communication relative to a benchmark time:
•If you are looking at a past shift, the benchmark time is the end of that shift.
•If you are looking at the current shift, the benchmark time is the

Less than 30 minutes
Text: ONLINE
More than 30 minutes but less than one hour
Text: Last Communication followed by the last communication timestamp.
More than one hour
Text: Last Communication followed by the last communication timestamp.