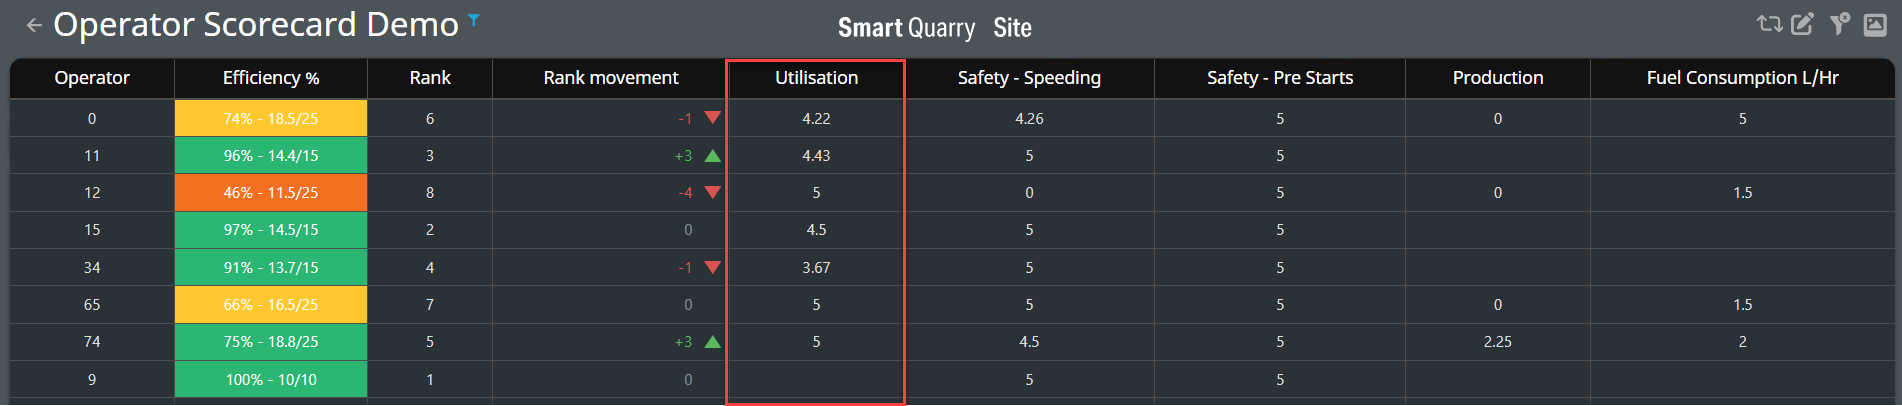
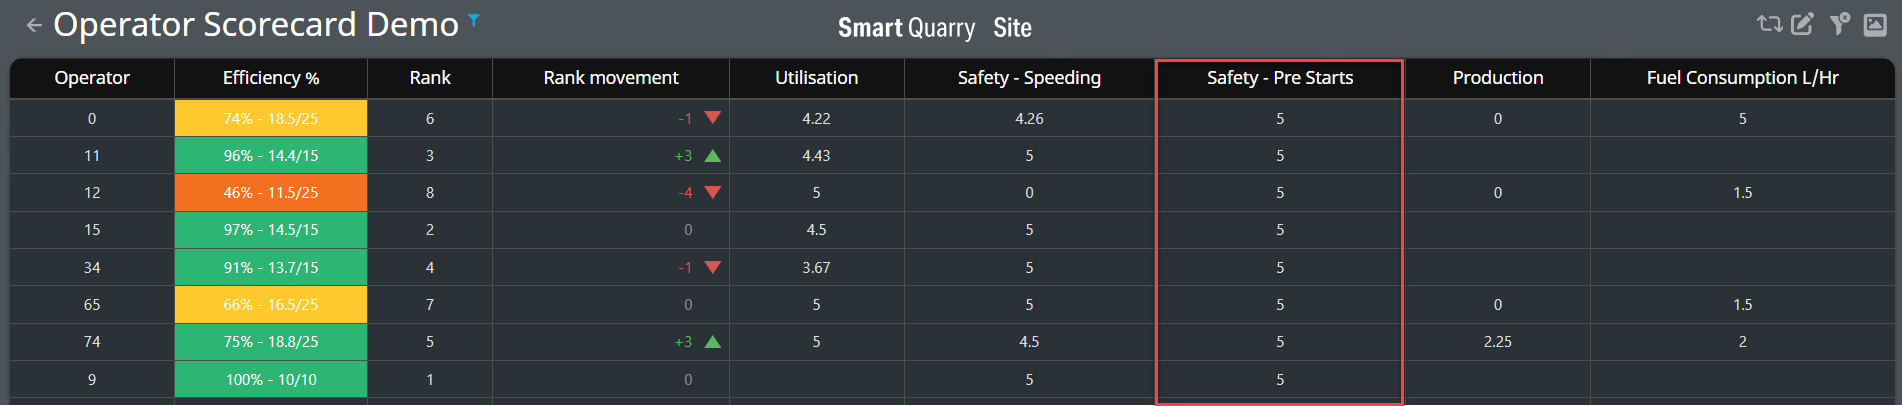
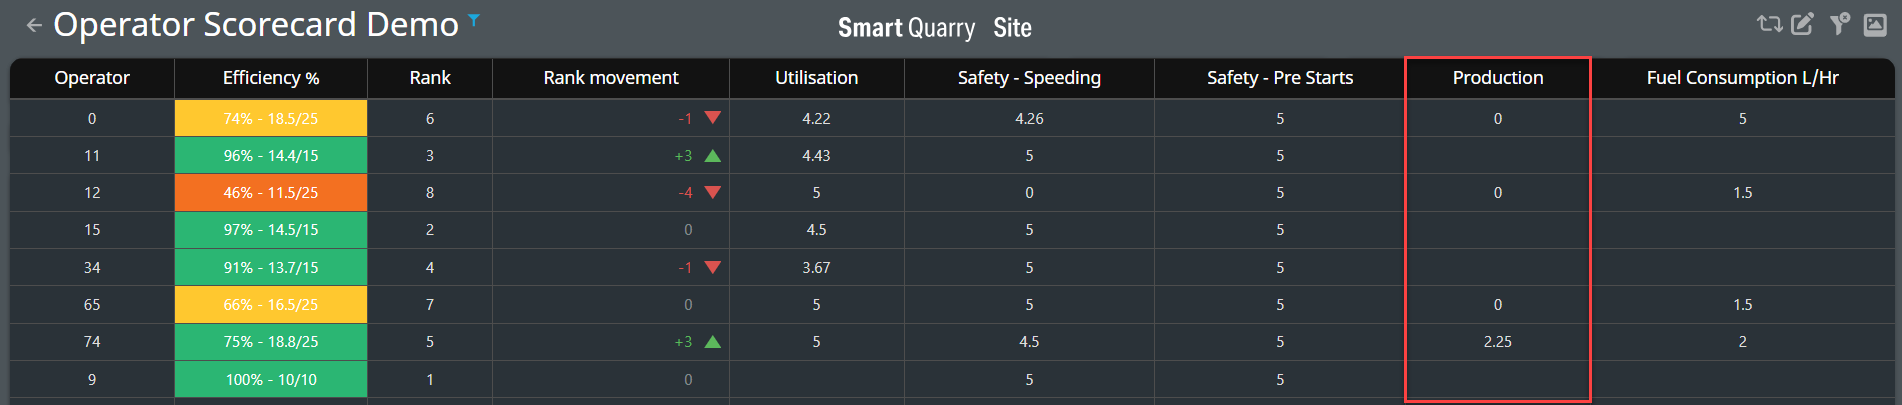
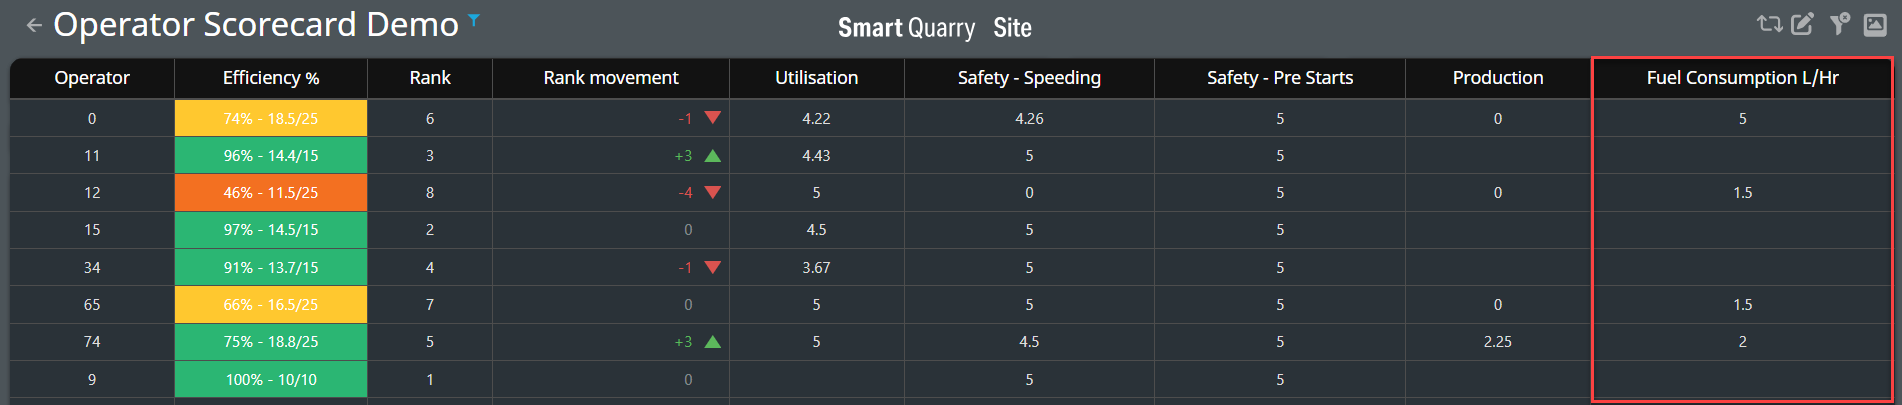
The Operator Scorecard dashboard displays the performance of operators that were active at a specific site during a specific time span. You can use the Operator Scorecard to monitor operator efficiency, road safety, pre-start compliance, productivity, and fuel efficiency
You can use the filters in the top bar of the dashboard to display data for a given time span. You can also filter the data to focus on specific shifts, circuits, or devices.
How to can be found @ Using Smart Quarry Site Dashboards [SQS] - User Guides
Operator Scorecard - Table of Contents
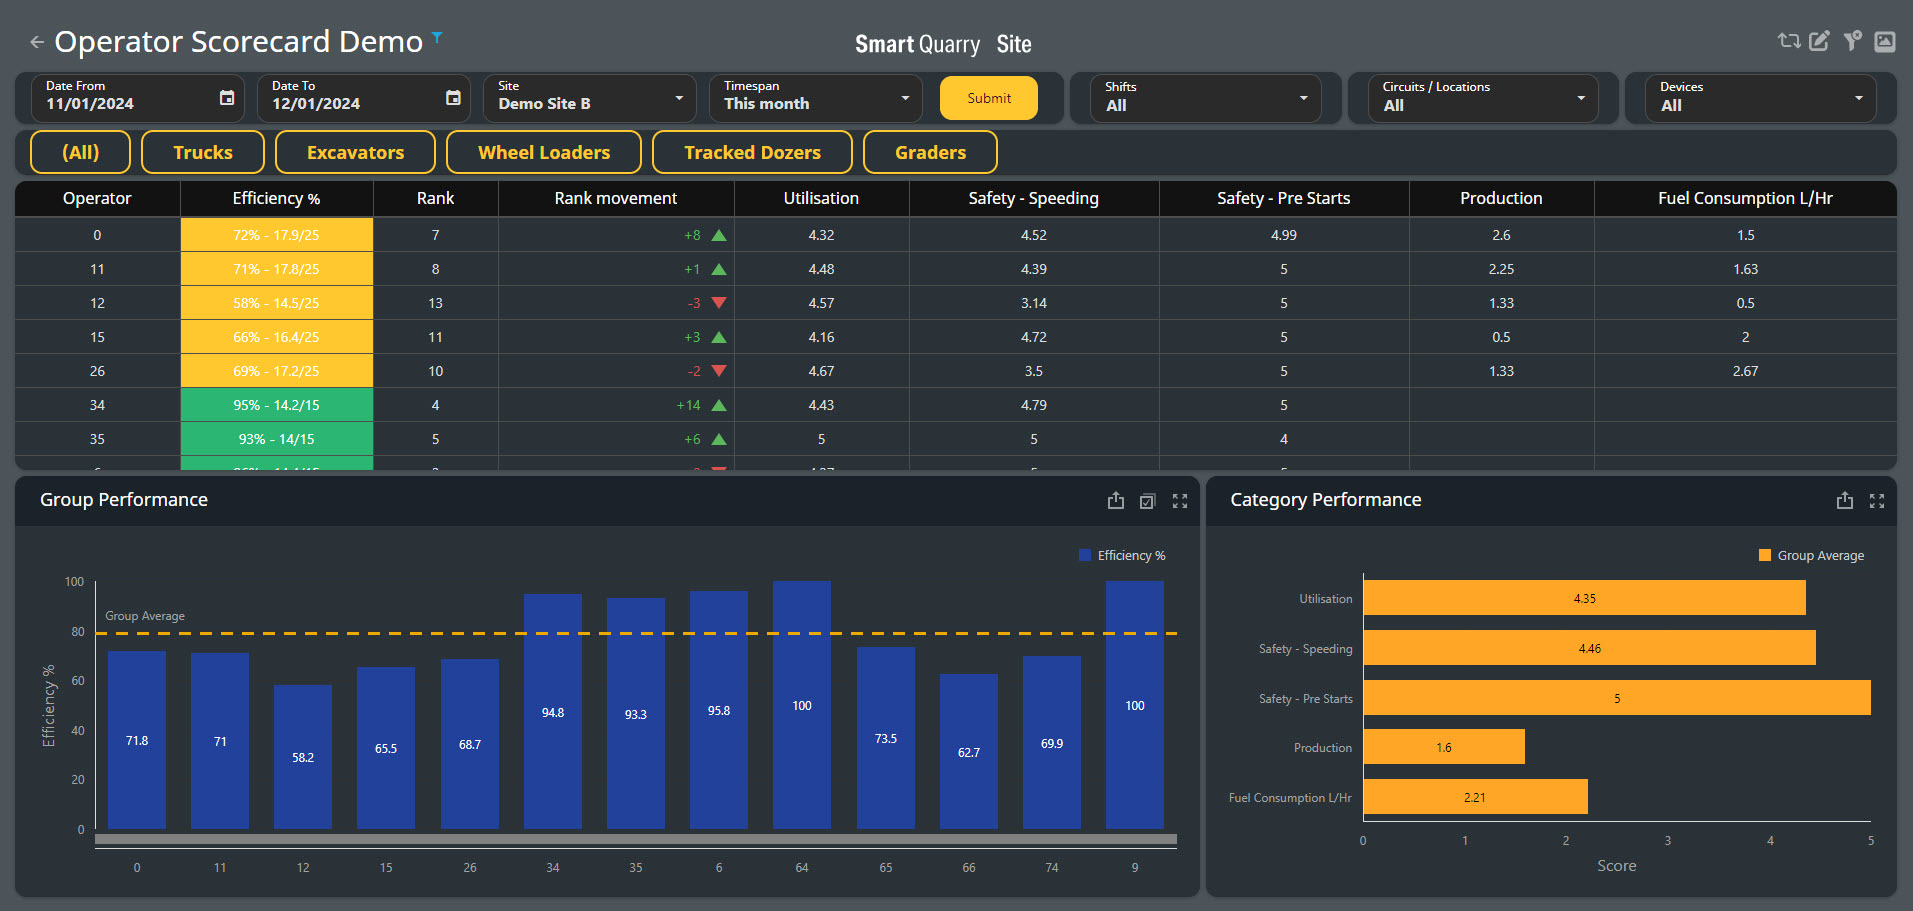
Operator Table
-
The Operator table lists all the operators that were active for the selected time span
Operator
-
Name or ID number of the operator.
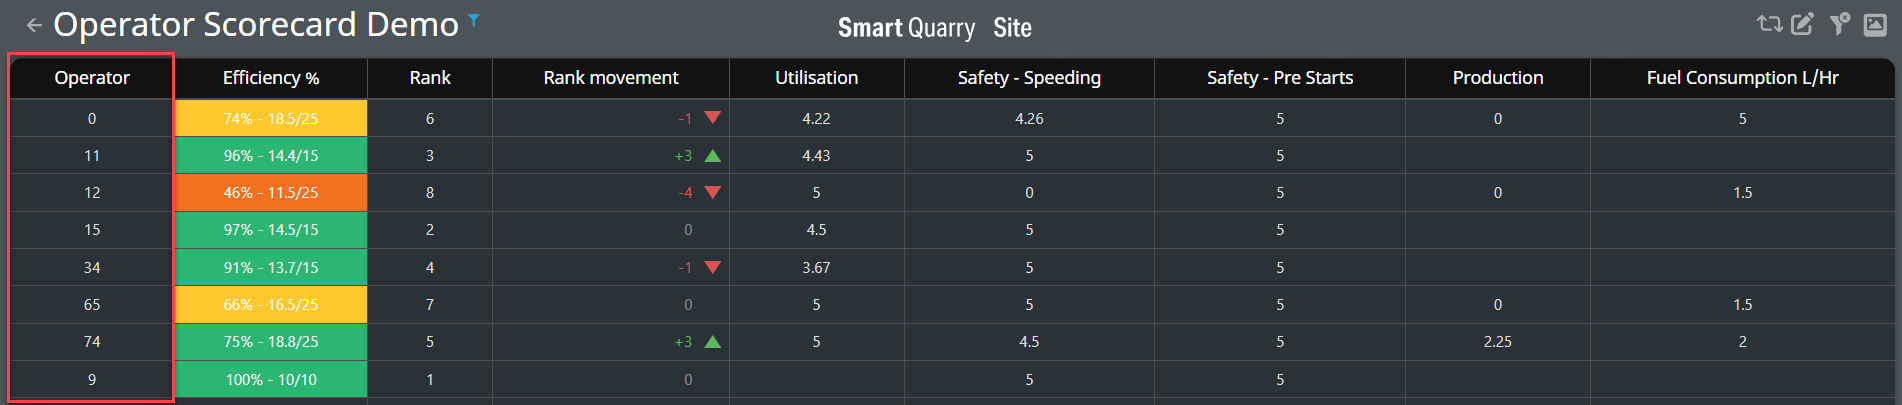
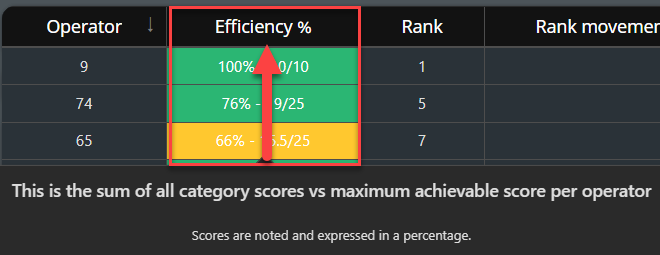
Efficiency %
-
An operator's cumulative score compared to the maximum achievable score, calculated as follows:
-
(operator score / possible score) * 100%
-
Efficiency is expressed as a percentage, and is colour coded as follows:

Efficiency Tool TIP - Tool Tips can be used by hovering over the heading of the selected Column
The Colour for the Efficiency% column is calculated as follows:

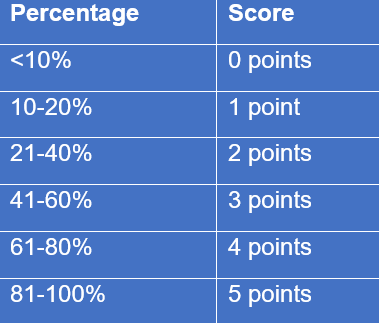
0-24% Efficiency
25-49% Efficiency
50-74% Efficiency
75-100% Efficiency
Rank
-
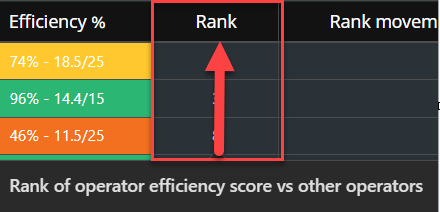
How the operator's efficiency score ranks relative to other operators that were active during the selected time span.
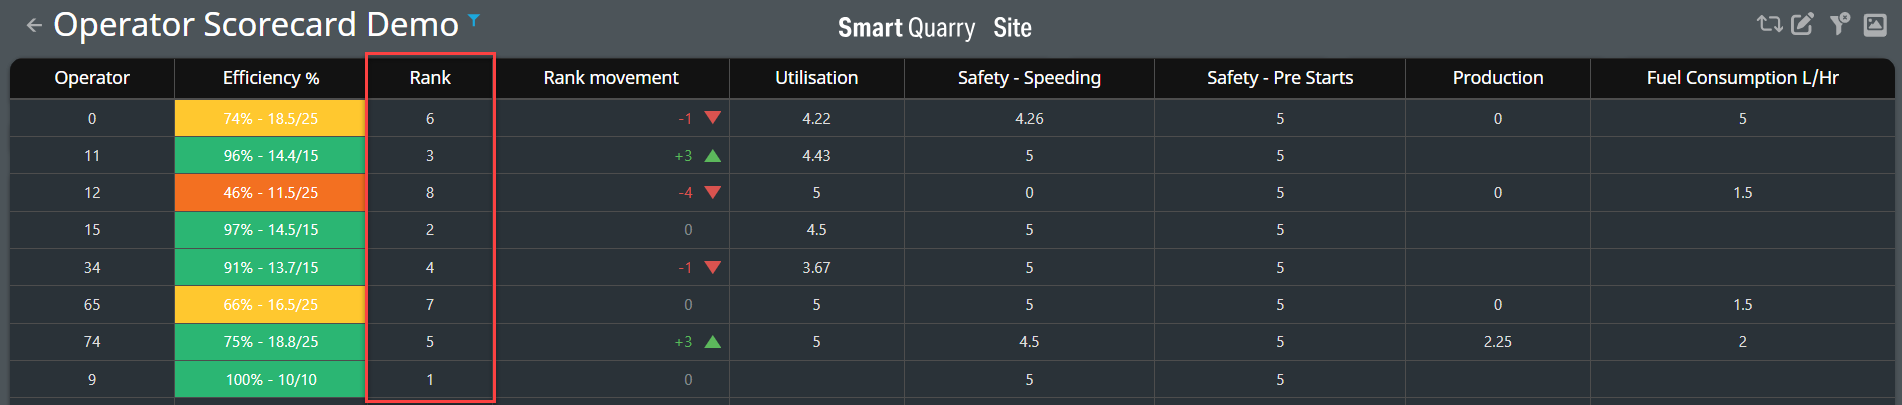
Rank Tool TIP - Tool Tips can be used by hovering over the heading of the selected Column
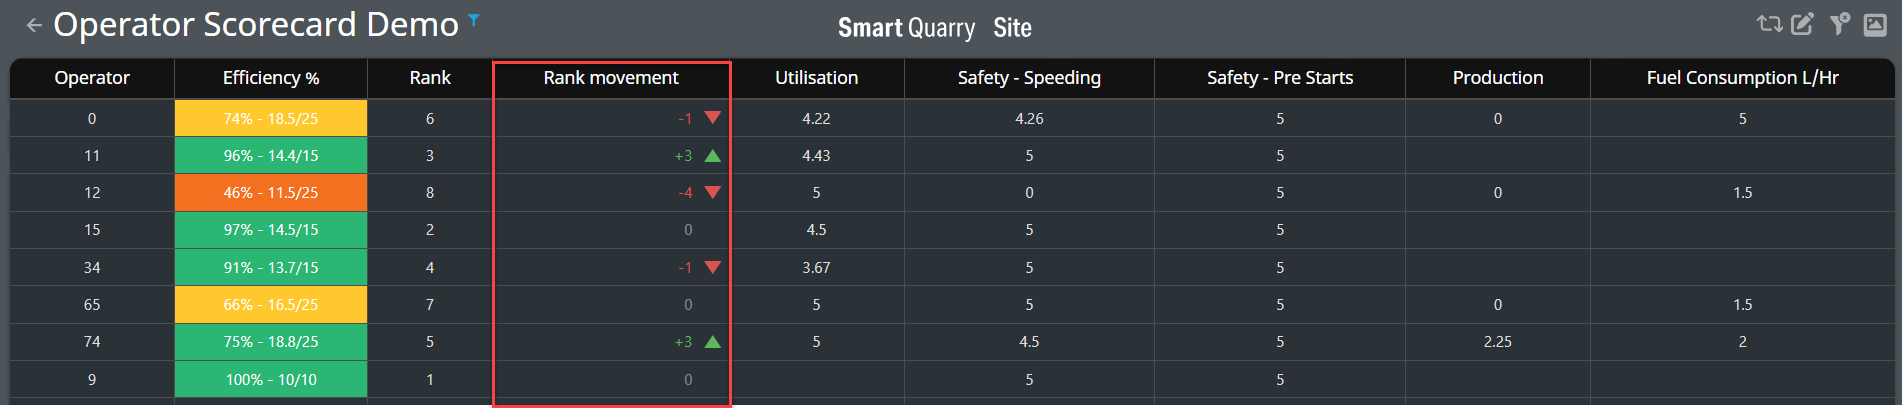
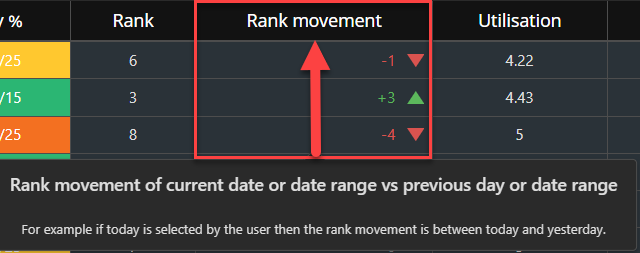
Rank Movement
-
How the operator’s rank has changed compared to the previous time span.
-
For example, if today is selected, the rank movement compares today's rank with yesterday's rank for the operator.
-
If the Rank Movement column is blank for an operator, they didn't work during the previous time span.
-
If the Rank Movement column has a value of 0, the operator's rank didn't change.
Rank Movement Toot TIP - Tool Tips can be used by hovering over the heading of the selected Column
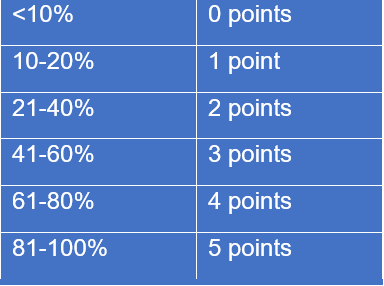
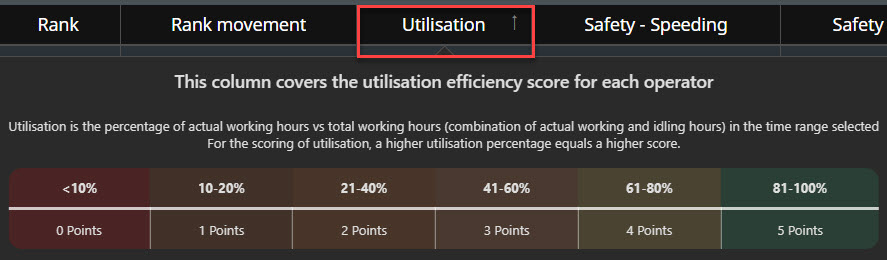
Utilisation - Scoring
-
A score of how efficiently the operator uses their vehicle during the selected time span or shift.
-
Utilisation is the percentage of actual working hours vs. total working hours (combination of actual working and idling hours) in the time range selected, which is calculated as follows:
-
(total working hours / total working hours + total idle hours) * 100%
-
For the scoring of utilisation, a higher utilisation percentage equals a higher score.
Utilisation Tool TIP - Tool Tips can be used by hovering over the heading of the selected Column
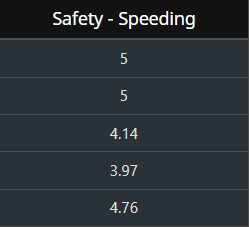
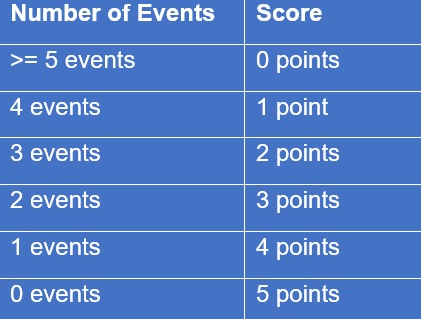
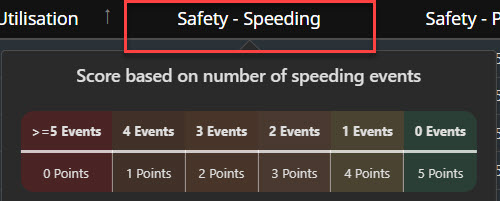
Safety - Speeding
A score of how safely the operator uses their vehicle, based on the number of speeding events during the selected time span.

-
Speeding areas in the SITE are based on site specific speeds and are Geo-fenced to allow for loaded and unloaded speeding settings to be made in the site master data.
Safety - Speeding Tool TIP - Tool Tips can be used by hovering over the heading of the selected Column
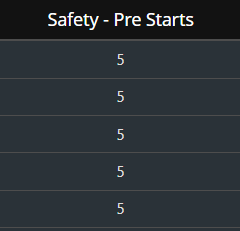
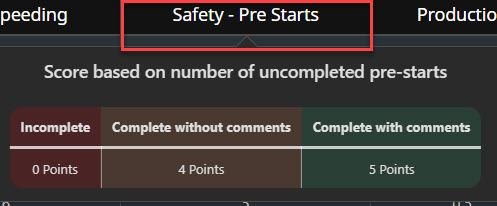
Safety Pre-Starts
-
A score of how safely the operator uses their vehicle, based on the completion and quality of their pre-start checks.
-
If an operator does not have a Safety – Pre-Start score, they do not have any pre-start reports associated with them for the selected time span.
|
Quality of pre-start check |
Score |
|---|---|
|
Incomplete |
0 points |
|
Complete without comments |
4 points |
|
Complete with comments |
5 points |
Safety - PreStart Tool TIP - Tool Tips can be used by hovering over the heading of the selected Column
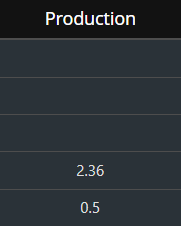
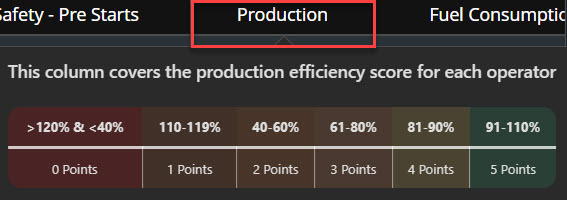
Production
-
Trucks only. The dashboard displays a blank entry for operators of other vehicle types
-
A score of how efficiently the operator uses their truck to haul product and waste during the selected time span. The production percentage is based on how close the load cycle weight is to the target tonnage for that vehicle, and is calculated as follows:(total actual tonnes hauled / total target tonnes) * 100%
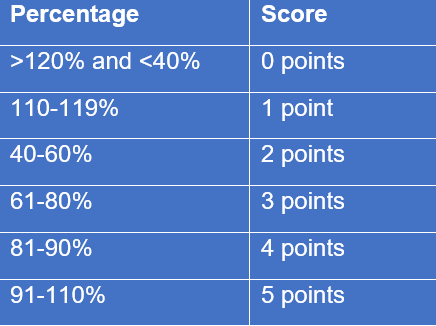
Production Tool TIP - Tool Tips can be used by hovering over the heading of the selected Column
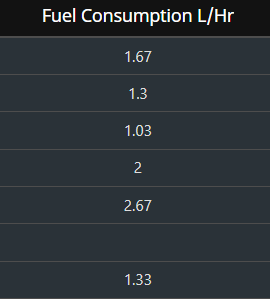
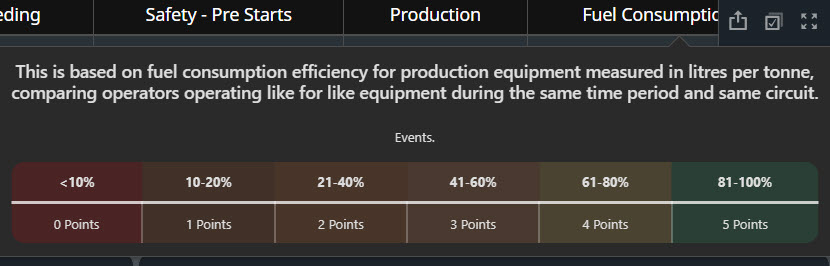
Fuel Consumption
-
The dashboard displays a blank entry for operators of other vehicle types.
-
A score of how efficiently the operator uses fuel during the selected time span compared to the operator with the lowest fuel consumption rate using the same vehicle model on the same circuit.
-
Operator's fuel consumption rate / lowest fuel consumption rate) * 100%
-
The fuel consumption rate is measured in litres per tonne. The lowest fuel consumption rate is from data from the previous 28 days.
Fuel Consumption Tool TIP - Tool Tips can be used by hovering over the heading of the selected Column
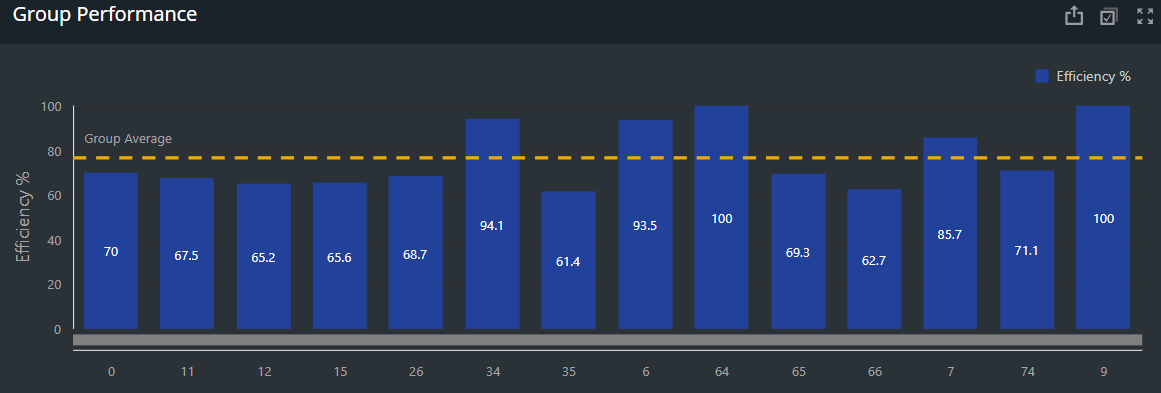
Group Performance chart
-
The Group Performance chart displays the efficiency score on the vertical axis and the operators that were active during the selected time span on the horizontal axis.
-
The yellow dotted line shows the group average efficiency score. The group average line changes based on what filters you select. For example, if you select 4 out of 10 operators, the group average line is the average of only those four selected operators, not all operators.
-
If you select an operator in the Operators table, the dashboard displays only that operator in the Group Performance chart, so no group average line is shown.
-
Hover over a bar in the chart to see a tooltip that displays an operator name and their efficiency score for the selected time span.
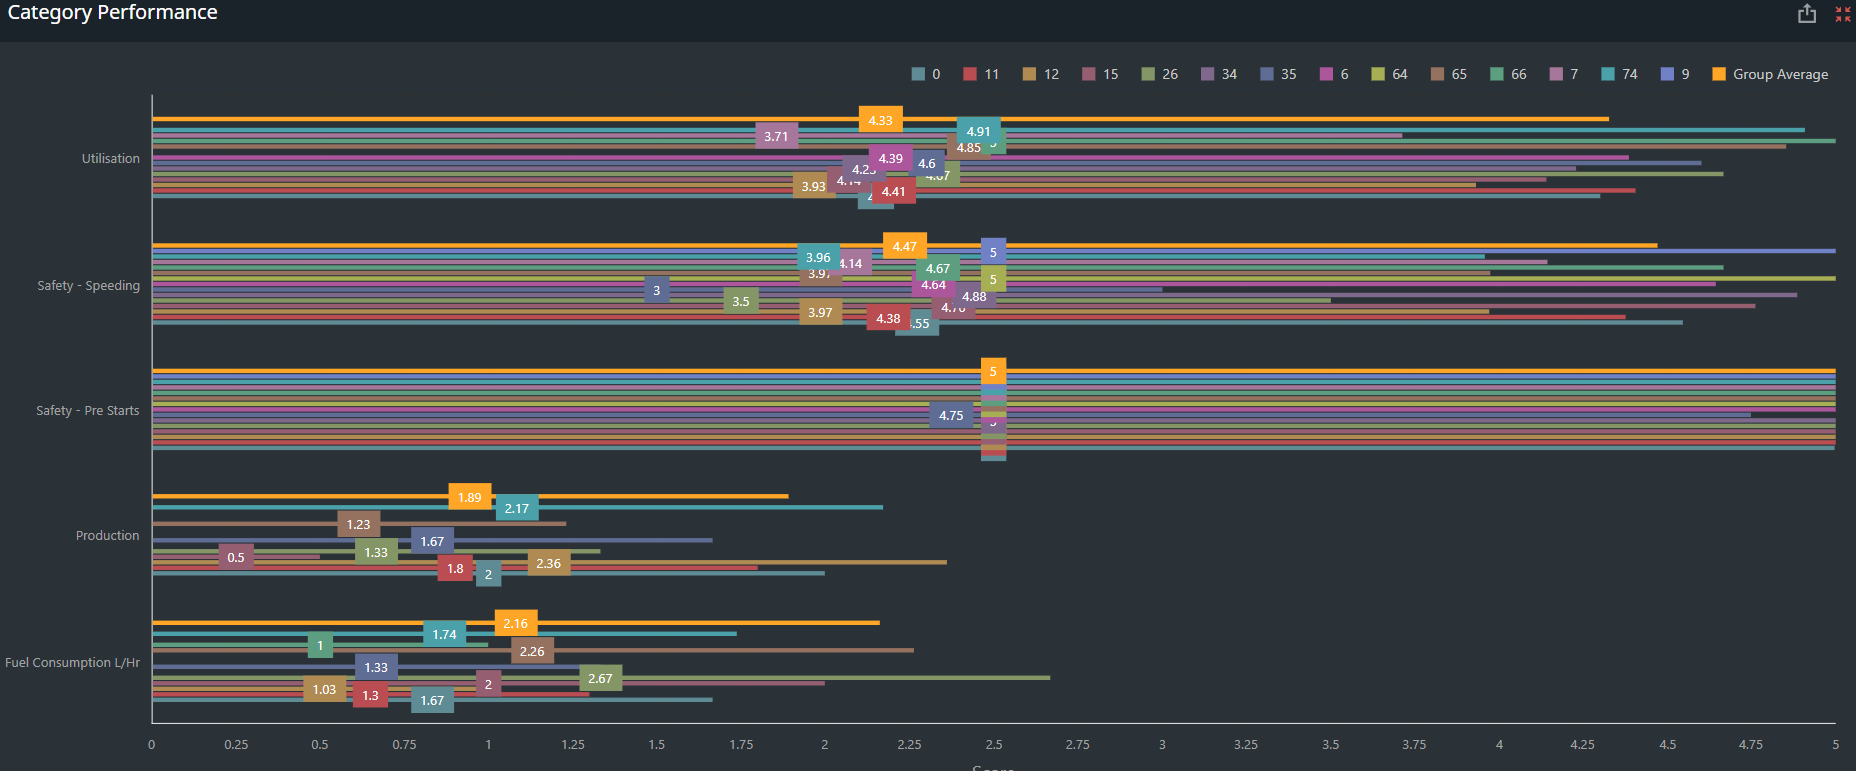
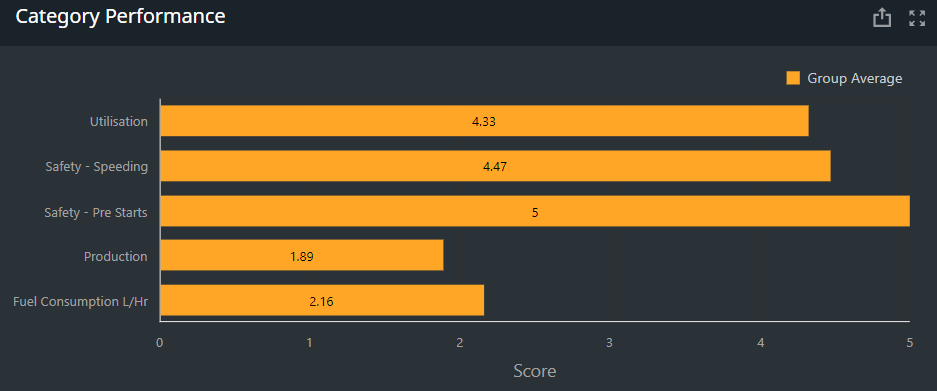
Category Performance chart
-
The Category Performance chart displays the group average for each category by default.
-
When you select an operator in the Operator table or Group Performance chart, an additional bar displays in the Category Performance chart for that specific operator comparing to the group performance average.
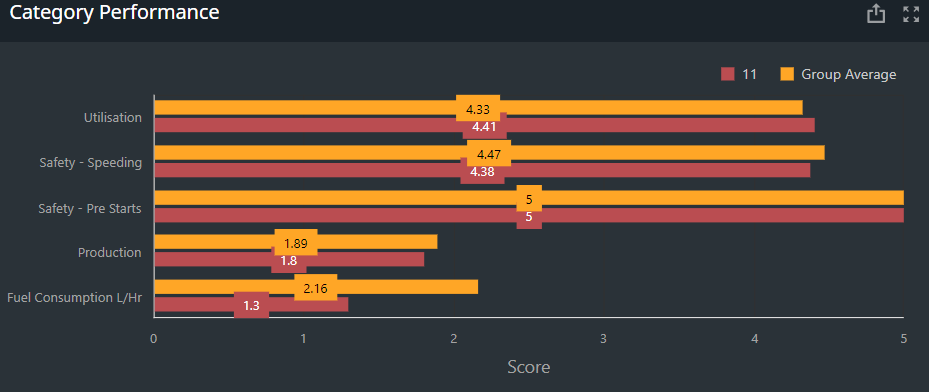
-
When you maximise this category performance card, you can review all operators against the group average. As a site manager or supervisor you can identify high performers and operators that require training. This is a pathway to best practice and allows you as the manager or supervisor to tagert train your operators.